Rice Consumption in Four Countries
The question
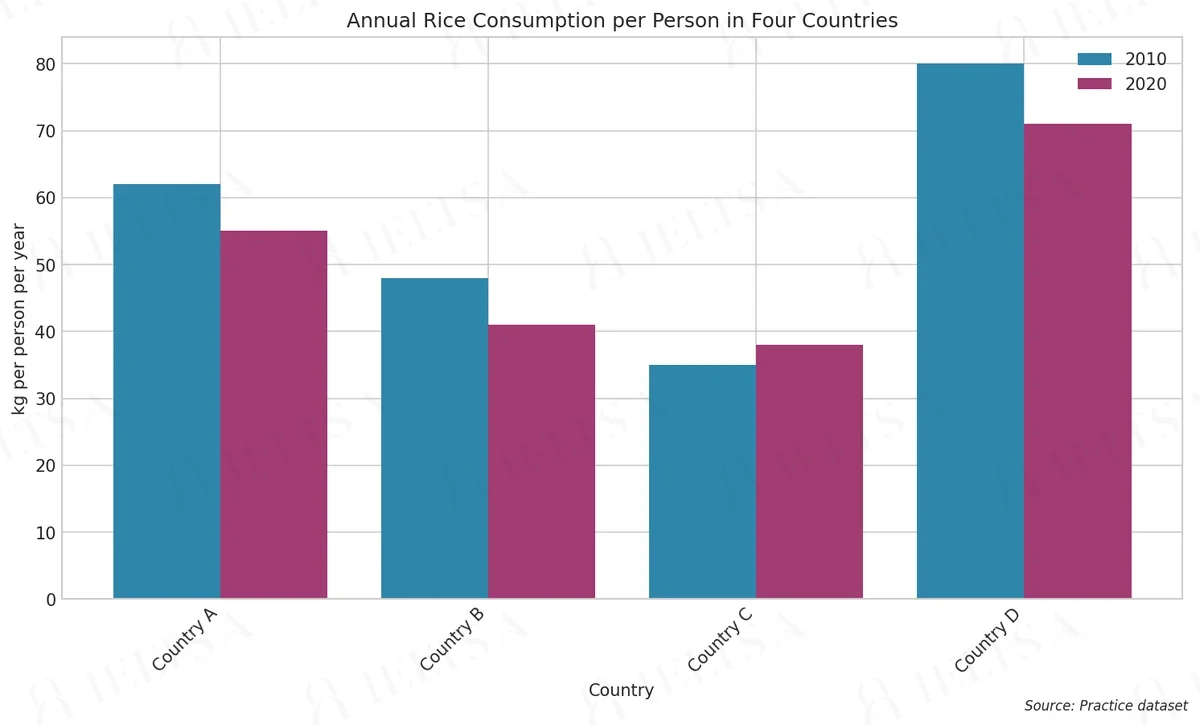
The bar chart below shows the average annual rice consumption per person in four countries in 2010 and 2020. Summarise the information by selecting and reporting the main features, and make comparisons where relevant.
Write at least 150 words.
Instructions
You should spend about 20 minutes on this task.
• Begin with an overview of the main trends or differences.
• Compare the countries with each other as well as over time.
• Use the figures and units shown on the chart where they help.
• Do not give your own opinions or speculate about causes.
How to approach this bar chart question
A bar chart compares categories or shows change between points in time. Write an overview of the biggest differences, then compare the highest, lowest and any surprise.
- Name the chart, the units and the time or places it covers in one sentence (paraphrase the question).
- Write an overview: the largest and smallest categories, or the main change over time.
- Group the bars into two body paragraphs by similarity, not one by one.
- Quote the key numbers only, with units, and compare them.
How to plan this answer
Structure
- Introduction: paraphrase the bar chart, which shows average annual rice consumption per person in four countries in 2010 and 2020, measured in kilograms.
- Overview: consumption fell in three of the four countries, Country C rose slightly, and Country D stayed the highest consumer in both years.
- Body paragraph 1: the 2010 figures and their ranking, from Country D (80 kg) down to Country C (35 kg).
- Body paragraph 2: the 2020 figures and the changes, including Country C's small rise and the narrowing gap between the highest and lowest countries.
Key features to spot
- Country D is highest in both years, at 80 kg in 2010 and 71 kg in 2020, a fall of 9 kg.
- Country C is the only country to rise, from 35 kg to 38 kg, and it is the lowest consumer in 2020.
- Countries A and B each fell by exactly 7 kg (62 to 55 kg and 48 to 41 kg).
- The ranking stays the same in both years: D, A, B, C. The gap between the highest and lowest countries narrows from 45 kg to 33 kg.
- Units matter: the figures are kilograms per person per year, so keep those units in your figures.
Useful vocabulary
- per person per year: Average rice consumption was 80 kg per person per year in Country D in 2010.
- remained the highest: Country D remained the highest consumer in both years.
- the only country to record an increase: Country C was the only country to record an increase.
- fell by: Consumption in Country A fell by 7 kg between 2010 and 2020.
- narrowed: The gap between the highest and lowest figures narrowed over the decade.
- stood at: Consumption in Country B stood at 41 kg in 2020.
- in both years: Country A ranked second in both years.
- a modest rise: Country C recorded a modest rise, from 35 kg to 38 kg.
Common mistakes
- Saying consumption fell in all four countries, which ignores the rise in Country C from 35 kg to 38 kg.
- Claiming the ranking changed, when the order of the four countries stays the same in both years.
- Writing that Country B fell by 9 kg, which confuses it with Country D's fall of 9 kg.
- Dropping the unit or writing kilos without 'per person per year', which makes the figures ambiguous.
- Explaining why rice consumption changed, which the prompt rules out.
Examiner tip: With two years and four countries, describe the 2010 order first, then the change for each country. Quoting the exact kilogram figures will keep the comparisons precise.
Write your answer
Sign in with Google to write online and get 8 free answers marked each month against the IELTS band criteria. No card, no password.
Sign in with Google to writeMore practice questions
Practise all four IELTS skills
Listening, Reading, Writing and Speaking with band 8 samples at ieltsa.org.