Savings Rates by Household Income Group
The question
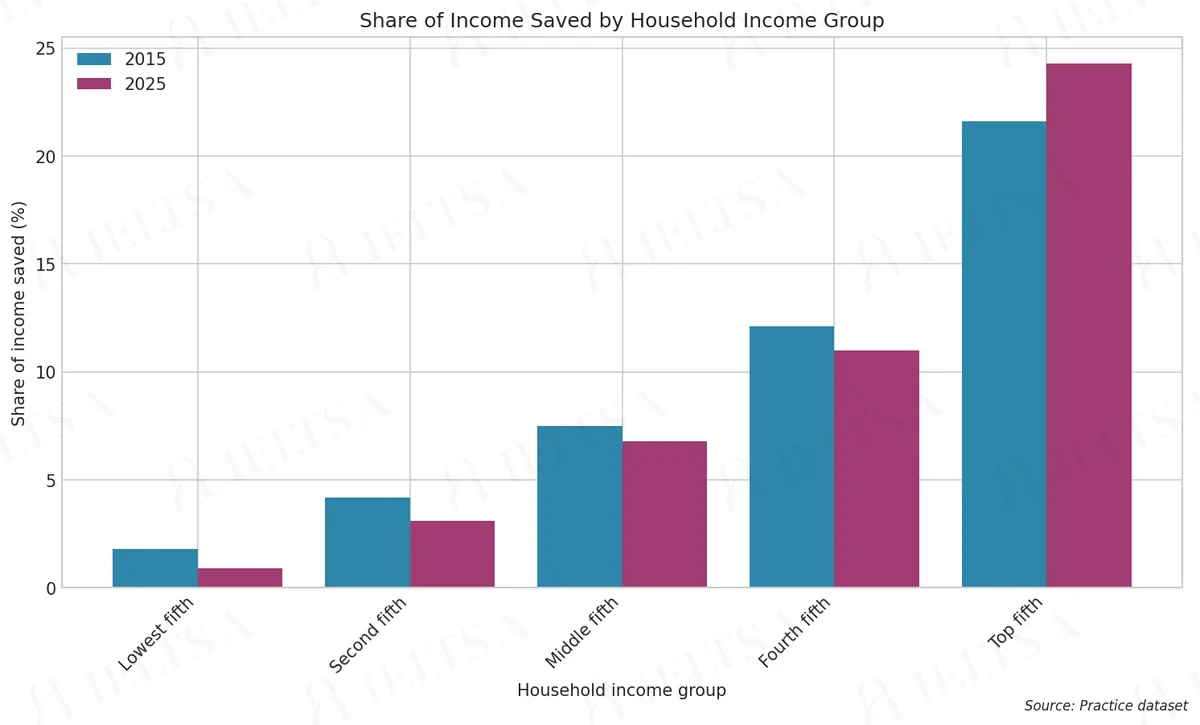
The bar chart below shows the share of income saved by households in five income groups in 2015 and 2025. Summarise the information by selecting and reporting the main features, and make comparisons where relevant.
Write at least 150 words.
Instructions
You should spend about 20 minutes on this task.
• Begin with an overview of the main trends or differences.
• Compare the income groups with each other as well as the changes between the two years.
• Use the percentages shown on the chart where they help.
• Do not give your own opinions or speculate about causes.
How to approach this bar chart question
A bar chart compares categories or shows change between points in time. Write an overview of the biggest differences, then compare the highest, lowest and any surprise.
- Name the chart, the units and the time or places it covers in one sentence (paraphrase the question).
- Write an overview: the largest and smallest categories, or the main change over time.
- Group the bars into two body paragraphs by similarity, not one by one.
- Quote the key numbers only, with units, and compare them.
How to plan this answer
Structure
- Introduction: paraphrase the bar chart, which shows the share of income saved by five household income groups in 2015 and 2025.
- Overview: the top fifth is the only group whose savings share rises, every other group saves a smaller share, and the gap between top and bottom widens.
- Body paragraph 1: the three lower groups (lowest fifth, second fifth and middle fifth), with their falls from 2015 to 2025.
- Body paragraph 2: the fourth fifth and the top fifth, including the rise in the top fifth and the widening gap between the top and lowest groups.
Key features to spot
- The top fifth rises from 21.6% to 24.3%, a gain of 2.7 percentage points, the only increase on the chart.
- The lowest fifth halves its share, from 1.8% to 0.9%.
- In 2025 the top fifth saves 27 times the share of the lowest fifth (24.3 against 0.9), compared with 12 times in 2015.
- The fourth fifth falls from 12.1% to 11.0%, and the second fifth falls from 4.2% to 3.1%.
- The gap between the top and lowest fifths widens from 19.8 points in 2015 to 23.4 points in 2025.
Useful vocabulary
- share of income saved: The top fifth's share of income saved rose over the decade.
- the only group to increase: The top fifth was the only group to increase its savings share.
- halved: The lowest fifth's share halved between 2015 and 2025.
- a rise of ... percentage points: The top fifth saw a rise of 2.7 percentage points.
- widened: The gap between the top and bottom groups widened.
- fell marginally: The middle fifth fell marginally, from 7.5% to 6.8%.
- in both years: The top fifth saved the largest share in both years.
- the gap between: The gap between the highest and lowest groups grew.
Common mistakes
- Saying all five groups saved less, which ignores the rise for the top fifth.
- Describing changes in shares as 'per cent' rather than percentage points, for example 'fell by 1.1 per cent'.
- Describing the lowest fifth's fall as a small drop of under a point, rather than noting that the share has halved.
- Explaining the widening gap with reasons such as income or policy, which the prompt does not allow.
- Mixing up the order of the groups, so the lowest and top fifths are described the wrong way round.
Examiner tip: With one clear exception to the pattern, name it early in the overview. Then group the other four groups in short sentences that include the change in the gap.
Write your answer
Sign in with Google to write online and get 8 free answers marked each month against the IELTS band criteria. No card, no password.
Sign in with Google to writeMore practice questions
Practise all four IELTS skills
Listening, Reading, Writing and Speaking with band 8 samples at ieltsa.org.