Communication Trends 2000-2020
The question
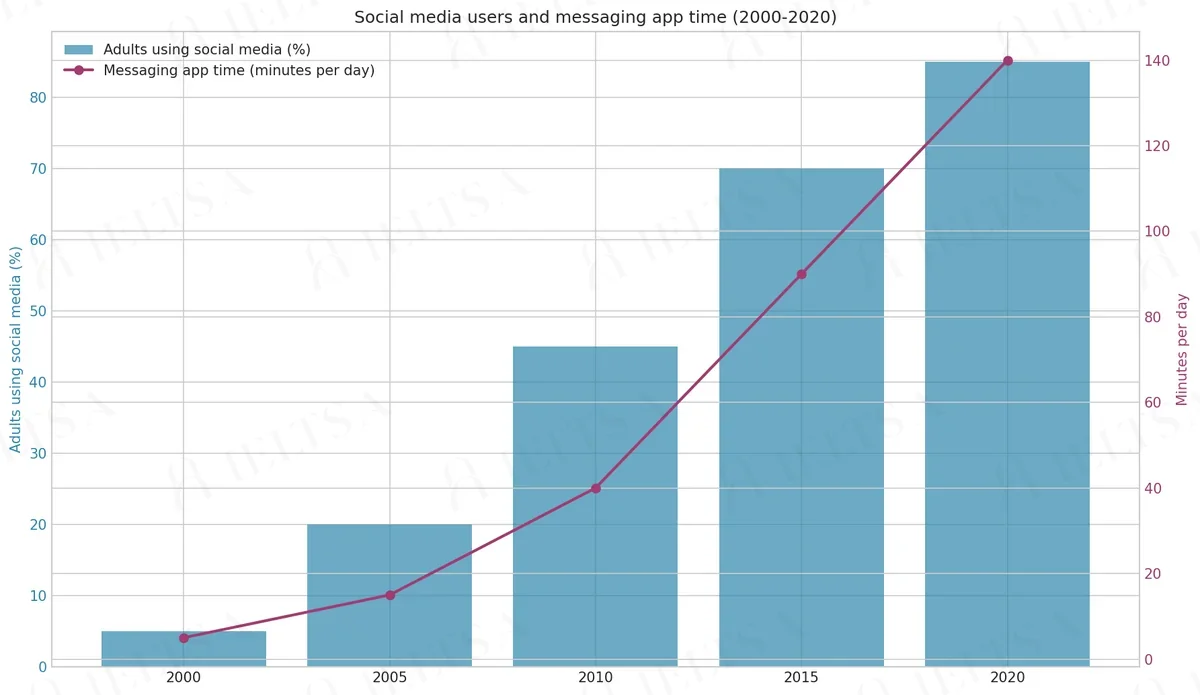
The chart below shows the percentage of adults who use social media (bars) and the average time they spend on messaging apps each day (line) between 2000 and 2020.
Summarise the information by selecting and reporting the main features, and make comparisons where relevant.
Write at least 150 words.
Instructions
You should spend about 20 minutes on this task.
• Begin with an overview of the main trends or differences
• Link the two sets of data: say how one helps to explain the other
• Use appropriate vocabulary for describing data
• Include figures and units to support your points
How to approach this mixed charts question
Mixed charts combine two views of the data (for example a bar chart and a line graph). Link them: say how one explains or contrasts with the other.
- Introduce both charts in one or two sentences.
- Write one overview covering both.
- Describe the first chart, then the second, linking where the data connects.
- Do not try to mention every number.
How to plan this answer
Structure
- Overview: one sentence stating that both the share of adults using social media and daily messaging time rose across 2000 to 2020.
- Body 1: the bar data, the share of adults using social media, which rose from 5 per cent to 85 per cent, with the largest increases between 2005 and 2015.
- Body 2: the line data, messaging app time, which rose from 5 to 140 minutes a day, with equal increases of 50 minutes in each of the last two periods.
- Body 3: a linking sentence that connects the two data sets, without claiming that one caused the other.
Key features to spot
- Adults using social media rose from 5 per cent in 2000 to 85 per cent in 2020, an increase of 80 percentage points.
- The biggest increases in social media use came between 2005 and 2010 and between 2010 and 2015, at 25 percentage points each.
- Messaging app time rose from 5 minutes a day to 140 minutes, which is 28 times the 2000 level.
- Messaging time increased by 50 minutes in both the 2010 to 2015 and 2015 to 2020 periods, faster than in any earlier period.
- Both measures started at 5 in 2000, so the two trends diverge sharply over the period.
- By 2020, 85 per cent of adults used social media and the average daily messaging time was 140 minutes, so the two trends rose together over time.
Useful vocabulary
- to climb in tandem with: Messaging time climbed in tandem with social media use.
- to rise 28-fold: Messaging time rose 28-fold between 2000 and 2020.
- to outpace: Messaging time outpaced the growth in social media use after 2010.
- percentage points: Social media use increased by 80 percentage points.
- more than doubled: The share of adults using social media more than doubled between 2005 and 2010.
- an accelerating trend: Messaging time shows an accelerating trend after 2010.
- a steady upward trajectory: Social media use follows a steady upward trajectory.
- to correlate with: Messaging time appears to correlate with social media use across the period.
- minutes per day: Average messaging time reached 140 minutes per day by 2020.
- to diverge: The two trends diverge most sharply after 2010.
Common mistakes
- Treating the two data sets as one measure, such as comparing 85 per cent with 140 minutes as if they were the same kind of figure.
- Calculating a percentage increase for the minutes data as though it were a percentage share.
- Stating that social media caused messaging time to rise, which the chart cannot show.
- Failing to identify which data set is the bar and which is the line.
- Ignoring the linking requirement, which asks you to connect the two sets of data in your summary.
Examiner tip: Describe each data set in its own paragraph, then add one linking sentence that connects them without assuming causation, since the task asks for a link.
Write your answer
Sign in with Google to write online and get 8 free answers marked each month against the IELTS band criteria. No card, no password.
Sign in with Google to writeMore practice questions
Practise all four IELTS skills
Listening, Reading, Writing and Speaking with band 8 samples at ieltsa.org.