Tourist Arrivals and Tourism's Share of GDP
The question
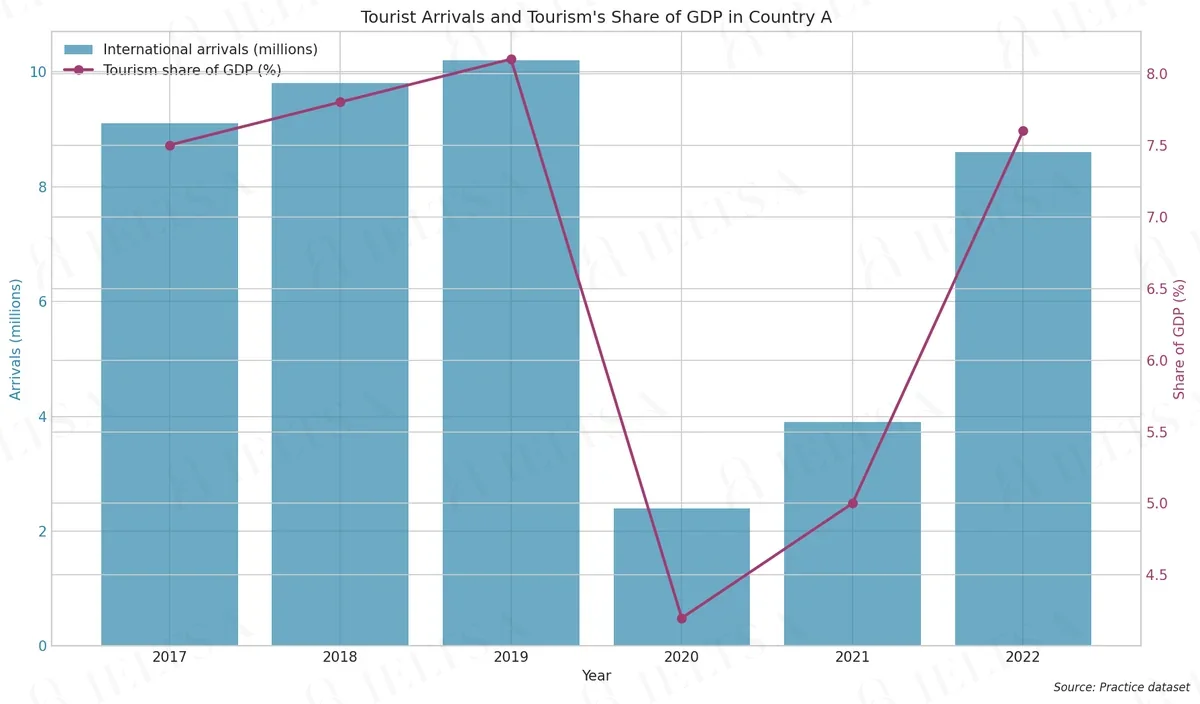
The bar chart and line graph below show the number of international tourist arrivals in Country A and the share of its GDP that came from tourism between 2017 and 2022. Summarise the information by selecting and reporting the main features, and make comparisons where relevant.
Write at least 150 words.
Instructions
You should spend about 20 minutes on this task.
• Begin with an overview of the main trends or differences.
• Compare the two measures with each other as well as over time.
• Use the figures and units shown on the chart where they help.
• Do not give your own opinions or speculate about causes.
How to approach this mixed charts question
Mixed charts combine two views of the data (for example a bar chart and a line graph). Link them: say how one explains or contrasts with the other.
- Introduce both charts in one or two sentences.
- Write one overview covering both.
- Describe the first chart, then the second, linking where the data connects.
- Do not try to mention every number.
How to plan this answer
Structure
- Introduction: paraphrase the two charts, a bar chart of international tourist arrivals (millions) and a line graph of tourism's share of GDP (%) in Country A from 2017 to 2022.
- Overview: both measures rise to a peak in 2019, drop sharply in 2020, and recover in 2021 and 2022 without fully returning to 2019 levels.
- Body paragraph 1: the rise from 2017 to 2019, with arrivals increasing from 9.1 to 10.2 million and the GDP share from 7.5% to 8.1%.
- Body paragraph 2: the fall in 2020 and the recovery in 2021 and 2022, giving the figures for each measure.
Key features to spot
- Arrivals peak at 10.2 million in 2019 and fall to 2.4 million in 2020, a drop of 7.8 million, or about three-quarters.
- Tourism's share of GDP peaks at 8.1% in 2019 and reaches a low of 4.2% in 2020.
- By 2022 arrivals reach 8.6 million, still 1.6 million short of the 2019 peak, and the GDP share is 7.6%, half a point below 2019.
- The two measures move in the same direction in every year, which is worth stating as a link between them.
- The 2021 recovery is sharper in arrivals (up 1.5 million, around 60%) than in the GDP share (up 0.8 points).
Useful vocabulary
- peaked at: Arrivals peaked at 10.2 million in 2019.
- plunged: Arrivals plunged to 2.4 million in 2020.
- rebounded: Tourism's share of GDP rebounded in the following two years.
- remained below: The GDP share remained below its 2019 level in 2022.
- the share of GDP: The share of GDP from tourism fell to 4.2% in 2020.
- in tandem with: The GDP share moved in tandem with arrivals throughout the period.
- a sharp decline of ... million: There was a sharp decline of 7.8 million arrivals between 2019 and 2020.
- bottomed out: Arrivals bottomed out in 2020 before recovering.
Common mistakes
- Mixing units, for example describing the GDP share in millions or arrivals in percentages.
- Saying arrivals fell in 2021, when they rose from 2.4 million to 3.9 million.
- Claiming the GDP share fully recovered to its 2019 level; it reached 7.6% against 8.1%.
- Presenting the two charts as showing different trends, when they move together in every year.
- Naming a cause for the 2020 fall, such as a global event, which the prompt rules out.
Examiner tip: With two measures on different scales, describe each separately and then compare their direction. Always state the unit next to every figure you quote.
Model answers by band score
Written for this question to show what changes from one band to the next. Try the task yourself first, then compare.
Band 6 answer
The bar chart shows the number of international tourists coming to Country A and the line graph shows how much tourism made up of GDP, between 2017 and 2022.
Overall, both of the things went up at first, then fell down a lot in 2020, and then they went up again after that.
In 2017 there were 9.1 million tourist arrivals and tourism was 7.5% of GDP. In 2018 and 2019 the arrivals rose to 9.8 million and 10.2 million. The share of GDP also rose to 7.8% and 8.1%, which was the highest.
In 2020 the arrivals dropped very much to 2.4 million, and the share of GDP dropped to 4.2%. After that, in 2021 the arrivals went up to 3.9 million and the GDP share was 5.0%. In 2022 the number of tourists was 8.6 million and tourism was 7.6% of GDP, which is nearly the same as in 2017.
So the two measures moved in the same direction in all the years.
Why this is band 6
- Accurate figures for every year and a correct overview that both measures rose, collapsed in 2020 and recovered.
- Vocabulary is repetitive ('went up', 'dropped', 'rose') and some phrasing is awkward ('tourism made up of GDP', 'both of the things').
- The comparison between the two measures is only a short last sentence and not developed; 'nearly the same as in 2017' is vague.
- Band 7 would use varied trend vocabulary, name the 2020 low and 2019 peak in the overview and compare the two measures explicitly.
Band 7 answer
The bar chart shows the number of international tourist arrivals in Country A, while the line graph shows the proportion of GDP generated by tourism, from 2017 to 2022.
Overall, the two measures followed almost identical patterns: both rose slightly until 2019, fell sharply in 2020, and then recovered, although neither had returned fully to its 2019 level by 2022.
Between 2017 and 2019, arrivals increased steadily from 9.1 million to a peak of 10.2 million, and tourism's share of GDP grew from 7.5% to 8.1%. These were the highest figures for both measures over the period.
In 2020, arrivals collapsed to 2.4 million, a fall of more than 75%, and the contribution to GDP nearly halved to 4.2%. Both figures began to recover in 2021, reaching 3.9 million and 5.0% respectively. By 2022, arrivals had climbed to 8.6 million and the GDP share had reached 7.6%, which was just above the 2017 level of 7.5% but still below the 2019 peak of 8.1%.
It is notable that arrivals fell proportionally more than the GDP share.
Why this is band 7
- Clear overview linking both measures (rise, 2020 fall, recovery) and noting that the 2019 level was not regained.
- Good range and accuracy: 'peak', 'collapsed', 'nearly halved', plus a calculated fall of more than 75% (10.2 to 2.4).
- A few small lapses in precision, such as the vague closing sentence ('proportionally more') and a comparison with 2017 that could be tighter.
- Band 8 would remove such imprecision, quantify the 2022 recovery against 2019 and integrate the comparison of the two measures into the body rather than in one closing sentence.
Band 8 answer
The bar chart illustrates international tourist arrivals in Country A between 2017 and 2022, while the line graph shows the share of GDP that tourism accounted for over the same period.
Overall, the two measures moved almost in step: both edged upwards to 2019, plunged in 2020 and then recovered, although by 2022 neither had quite regained its 2019 level.
Arrivals grew from 9.1 million in 2017 to a peak of 10.2 million in 2019, and tourism's share of GDP rose in parallel from 7.5% to 8.1%. The 2020 slump was dramatic, with arrivals falling by over three quarters to 2.4 million and the GDP share dropping to 4.2%, its lowest point.
Recovery began in 2021, when arrivals reached 3.9 million and the GDP share 5.0%. The rebound then accelerated: in 2022, arrivals stood at 8.6 million, roughly 84% of the 2019 figure, and tourism contributed 7.6% of GDP, only 0.5 percentage points below its peak. Proportionally, the GDP share therefore recovered more fully than visitor numbers did.
In short, tourism's economic weight tracked visitor numbers closely throughout.
Why this is band 8
- The overview captures the shared shape of both measures and the incomplete recovery, in a single precise sentence.
- Detail is well chosen and exact (10.2 to 2.4 'over three quarters', 7.6% 'only 0.5 percentage points below its peak').
- Cohesion is natural ('in parallel', 'The rebound then accelerated') and errors are rare; the comparison is built into the paragraphs.
- The closing observation is a data-based comparison rather than speculation, as the task requires; Band 9 would be even more economical and fold this comparison into the 2020 slump description.
Band 9 answer
The bar chart shows international tourist arrivals in Country A from 2017 to 2022, and the line graph shows tourism's share of the country's GDP over the same years.
Overall, the two measures rose modestly to a common peak in 2019, collapsed in 2020, and then recovered in tandem, with neither fully regaining its pre-pandemic level by 2022.
Arrivals climbed from 9.1 million in 2017 to 10.2 million in 2019, while tourism's contribution to GDP edged up from 7.5% to 8.1%. The 2020 slump was severe: arrivals fell by roughly 76% to 2.4 million, whereas the GDP share declined by a smaller margin, from 8.1% to 4.2%, a drop of just under half.
Both indicators then rebounded. Arrivals reached 3.9 million in 2021 and 8.6 million in 2022, about 84% of the 2019 total, and the GDP share rose to 5.0% and then 7.6%, leaving it just half a percentage point short of its peak. In other words, tourism's share of GDP recovered slightly more completely than visitor numbers.
Throughout the period, the two series moved in the same direction in every year.
Why this is band 9
- The overview identifies the shared 2019 peak, the 2020 collapse and the incomplete recovery in one fluent sentence.
- Calculations are correct and well chosen (about 76% fall, just under half, about 84%, half a percentage point), and they sharpen the comparison of the two measures.
- Phrasing such as 'in tandem' and 'just half a percentage point short' is natural and error-free, with no speculation about causes.
- Comparison of the two measures is embedded in the paragraphs, so the report reads as a single coherent analysis.
Band levels are our estimate against the public IELTS criteria; they are not official scores.
Write your answer
Sign in with Google to write online and get 8 free answers marked each month against the IELTS band criteria. No card, no password.
Sign in with Google to writeMore practice questions
Practise all four IELTS skills
Listening, Reading, Writing and Speaking with band 8 samples at ieltsa.org.