Journal Articles by Field in Three Countries
The question
Instructions
How to approach this bar chart question
A bar chart compares categories or shows change between points in time. Write an overview of the biggest differences, then compare the highest, lowest and any surprise.
- Name the chart, the units and the time or places it covers in one sentence (paraphrase the question).
- Write an overview: the largest and smallest categories, or the main change over time.
- Group the bars into two body paragraphs by similarity, not one by one.
- Quote the key numbers only, with units, and compare them.
How to plan this answer
Structure
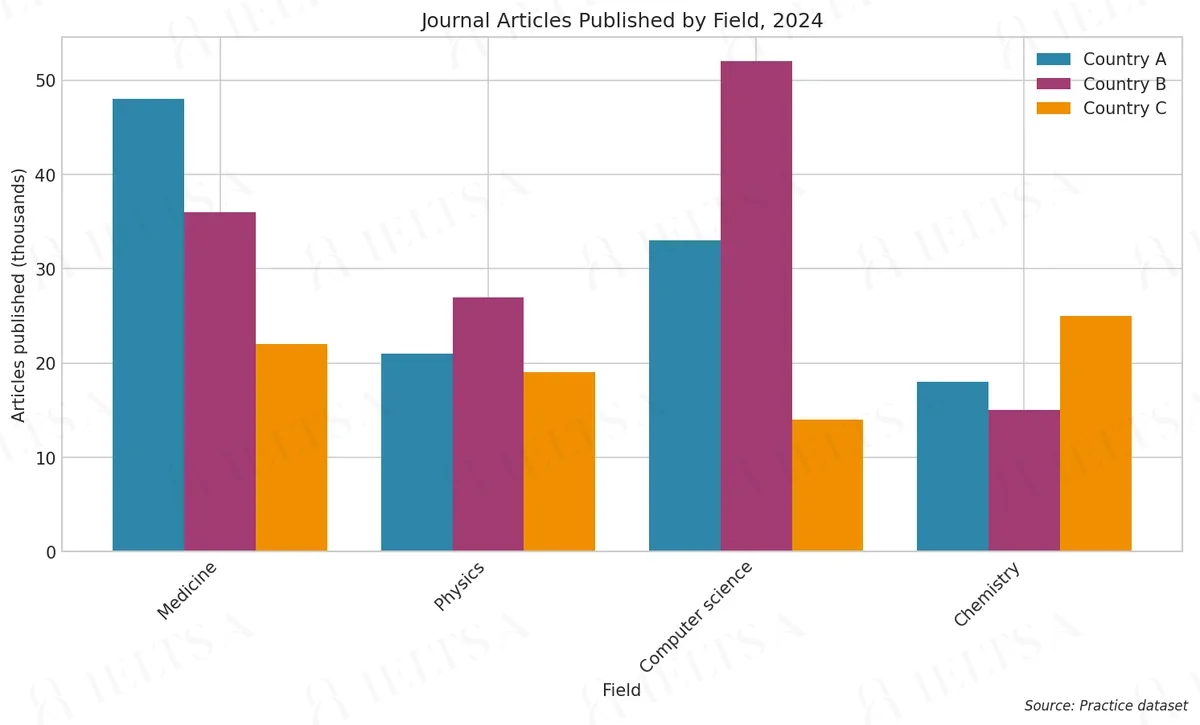
- Introduction: paraphrase the bar chart, which shows the number of journal articles published in four scientific fields by three countries in 2024.
- Overview: no single country leads in every field, Country B publishes the most articles overall, and the picture is closest in physics and chemistry.
- Body paragraph 1: medicine and computer science, where Country A leads medicine (48 thousand) and Country B leads computer science (52 thousand).
- Body paragraph 2: physics and chemistry, where Country B narrowly leads physics and Country C leads chemistry, with the smaller margins noted.
Key features to spot
- Country B leads in computer science with 52 thousand articles, 19 thousand more than Country A and 38 thousand more than Country C.
- Country A leads medicine with 48 thousand articles, more than double Country C's 22 thousand.
- In physics Country B leads with 27 thousand, narrowly ahead of Country A (21) and Country C (19).
- Country C leads chemistry with 25 thousand, ahead of Country A (18) and Country B (15).
- Summed across the four fields, Country B publishes around 130 thousand articles, Country A around 120 thousand and Country C around 80 thousand.
Useful vocabulary
- thousand articles: Country B published 52 thousand articles in computer science.
- led the way: Country B led the way in computer science.
- the highest number of: Country A had the highest number of medicine articles.
- narrowly ahead of: Country B was narrowly ahead of Country A in physics.
- well ahead of: Country B was well ahead of Country C in computer science.
- by a considerable margin: Country B led computer science by a considerable margin.
- more than double: Country A's medicine output is more than double that of Country C.
- the picture is less clear: In physics, the picture is less clear, as the gaps are small.
Common mistakes
- Presenting the figures as raw article counts, when they are in thousands; 36 means 36,000.
- Saying Country B leads in medicine, when Country A leads with 48 thousand against 36 thousand.
- Ignoring the close result in physics, where the three countries are within eight thousand of each other.
- Presenting the overall totals as if they were figures from the chart rather than sums that you have calculated.
- Adding reasons for the research output, such as funding levels, which the prompt rules out.
Examiner tip: Check each field separately for the leader and the margin. An overview that names the overall pattern, plus the close results, will show your understanding of the chart.
Model answers by band score
Written for this question to show what changes from one band to the next. Try the task yourself first, then compare.
Band 6 answer
Why this is band 6
- Relevant overview naming a leader in medicine and computer science, but it is incomplete: it does not mention that Country B also leads physics or that Country C leads chemistry.
- Language is limited and repetitive ('had ... thousand articles' many times) and contains errors such as 'The bar chart show' and 'Country A publish'.
- The final sentence ('every country was the leader in at least one field, except Country A in the last two') is confused and imprecise, which weakens accuracy.
- Band 7 would give a complete overview of who leads each field, group the data more clearly and use a wider range of comparison structures with fewer errors.
Band 7 answer
Why this is band 7
- Clear overview that states the leader in every field and singles out physics as the closest contest, which answers the task bullet directly.
- Well organised: one paragraph for the two fields with clear leaders, another for the less clear fields, with 'however' and 'therefore' used sensibly.
- Good range of comparison language ('well ahead of', 'narrowly', 'compared with') and only minor slips in precision.
- Band 8 would select and compare the data more economically (for example giving totals or ratios) and use more flexible, natural phrasing throughout.
Band 8 answer
Why this is band 8
- Precise overview that identifies each leader and also contrasts the most even field (physics) with the most unequal one (computer science).
- Detail is well selected and expressed with calculated comparisons ('a third more', 'more than double', 'almost four times'), all consistent with the figures.
- Cohesion is natural ('By contrast', 'respectively', 'therefore'), and grammar is accurate with only rare stylistic weaknesses.
- Band 9 would make the final insight tighter and fully natural; the last sentence is a little awkward and adds a point of limited value.
Band 9 answer
Why this is band 9
- Overview captures both the division of leadership and the contrast between the widest and narrowest fields, with no data errors.
- Every figure is accurate and selected for a purpose; the totals (130, 120 and 80 thousand) give a genuine summary that the other answers lack.
- Language is fully natural and varied ('outstrip', 'edges ahead of', 'cluster between') with no errors, and the cohesion never feels mechanical.
- Paragraphing follows the logic of the data: clear-cut fields first, closer fields second, then a closing summary.
Band levels are our estimate against the public IELTS criteria; they are not official scores.
Write your answer
Sign in with Google to write online and get 8 free answers marked each month against the IELTS band criteria. No card, no password.
Sign in with Google to writeMore practice questions
Practise all four IELTS skills
Listening, Reading, Writing and Speaking with band 8 samples at ieltsa.org.