Cycle Commuting in Three European Cities
The question
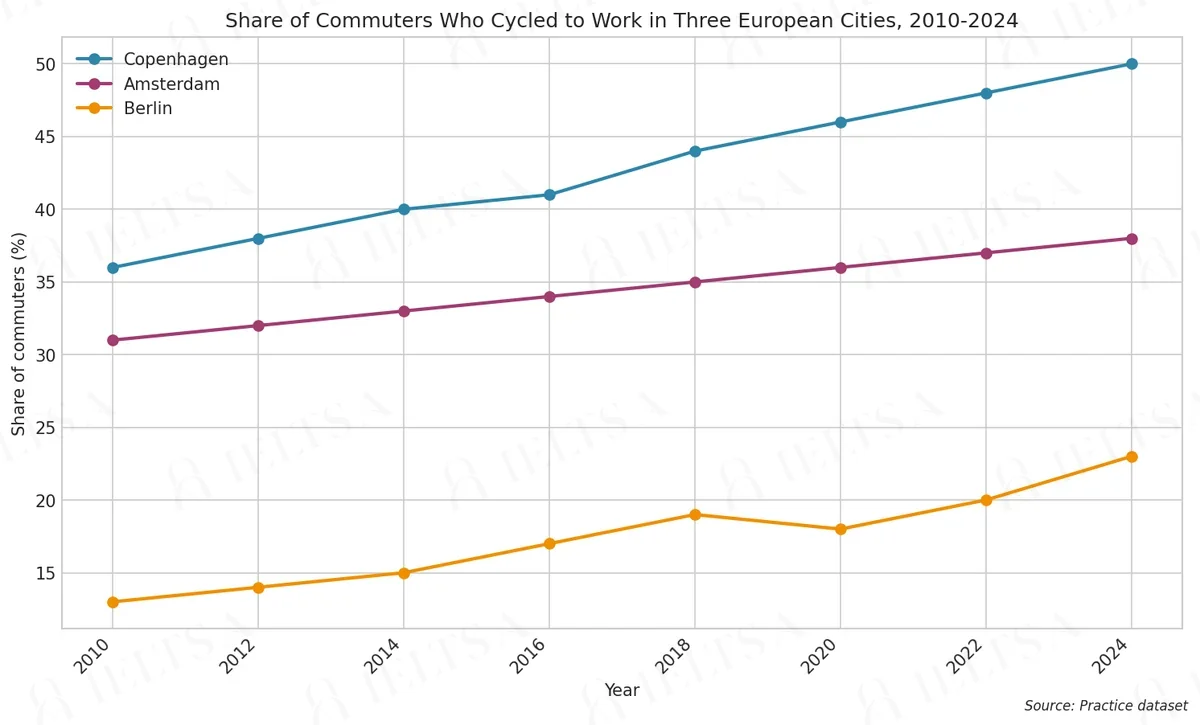
The line graph below shows the percentage of commuters who cycled to work in three European cities between 2010 and 2024. Summarise the information by selecting and reporting the main features, and make comparisons where relevant.
Write at least 150 words.
Instructions
You should spend about 20 minutes on this task.
• Begin with an overview of the main trends or differences.
• Compare the three cities with each other as well as over time.
• Use the figures and units shown on the chart where they help.
• Do not give your own opinions or speculate about causes.
How to approach this line graph question
A line graph shows change over time. Your job is to describe the trends and compare the lines, not to list every point.
- Paraphrase the question, giving the time span and units.
- Overview: the overall direction of each line and where they cross or finish.
- Describe each trend with a range of verbs (rose steadily, fell sharply, levelled off) and time markers.
- Mention the highest points, lowest points and any crossover.
How to plan this answer
Structure
- Introduction: paraphrase the line graph, which shows the percentage of commuters who cycled to work in three European cities between 2010 and 2024.
- Overview: all three cities show a rise, Copenhagen is highest throughout and Berlin the lowest, and the gap between Copenhagen and the others widens.
- Body paragraph 1: Copenhagen and Amsterdam, with Copenhagen rising from 36% to 50% and Amsterdam from 31% to 38% in steady steps.
- Body paragraph 2: Berlin, which rises from 13% to 23% with a single dip in 2020, and its relative growth compared with the other two.
Key features to spot
- Copenhagen's share rises by 14 points, from 36% to 50%, the largest rise of the three cities and the only one to reach 50%.
- Amsterdam rises by exactly one point every two years, from 31% in 2010 to 38% in 2024.
- Berlin's share rises by 10 points, roughly 77% of its 2010 level, the fastest relative growth of the three cities.
- Berlin's only fall is a dip from 19% in 2018 to 18% in 2020.
- The gap between Copenhagen and Amsterdam widens from 5 points in 2010 to 12 points in 2024.
Useful vocabulary
- the share of commuters: The share of commuters who cycled rose in Copenhagen.
- rose steadily: Cycling in Amsterdam rose steadily across the period.
- climbed from ... to ...: The share climbed from 13% to 23% in Berlin.
- the highest share: Copenhagen recorded the highest share throughout.
- dipped slightly: Berlin's share dipped slightly in 2020.
- remained the lowest: Berlin remained the lowest of the three cities.
- narrowed the gap: Berlin narrowed the gap with Amsterdam over the period.
- reached 50 per cent: Copenhagen reached 50 per cent in 2024.
Common mistakes
- Saying Berlin overtook Amsterdam, when it stayed well below (23% against 38% in 2024).
- Missing Berlin's dip in 2020, or describing all three lines as perfectly smooth rises.
- Describing Amsterdam's rise as rapid, when it is a steady one-point rise every two years.
- Writing 'percent' for changes in shares, rather than percentage points.
- Giving reasons for the higher cycling rate in Copenhagen, which the prompt rules out.
Examiner tip: Describe growth in points and in relative terms, because the smallest city can grow fastest in percentage terms. Name the one dip rather than calling the lines perfect rises.
Write your answer
Sign in with Google to write online and get 8 free answers marked each month against the IELTS band criteria. No card, no password.
Sign in with Google to writeMore practice questions
Practise all four IELTS skills
Listening, Reading, Writing and Speaking with band 8 samples at ieltsa.org.