Match Attendance in Two Football Leagues
The question
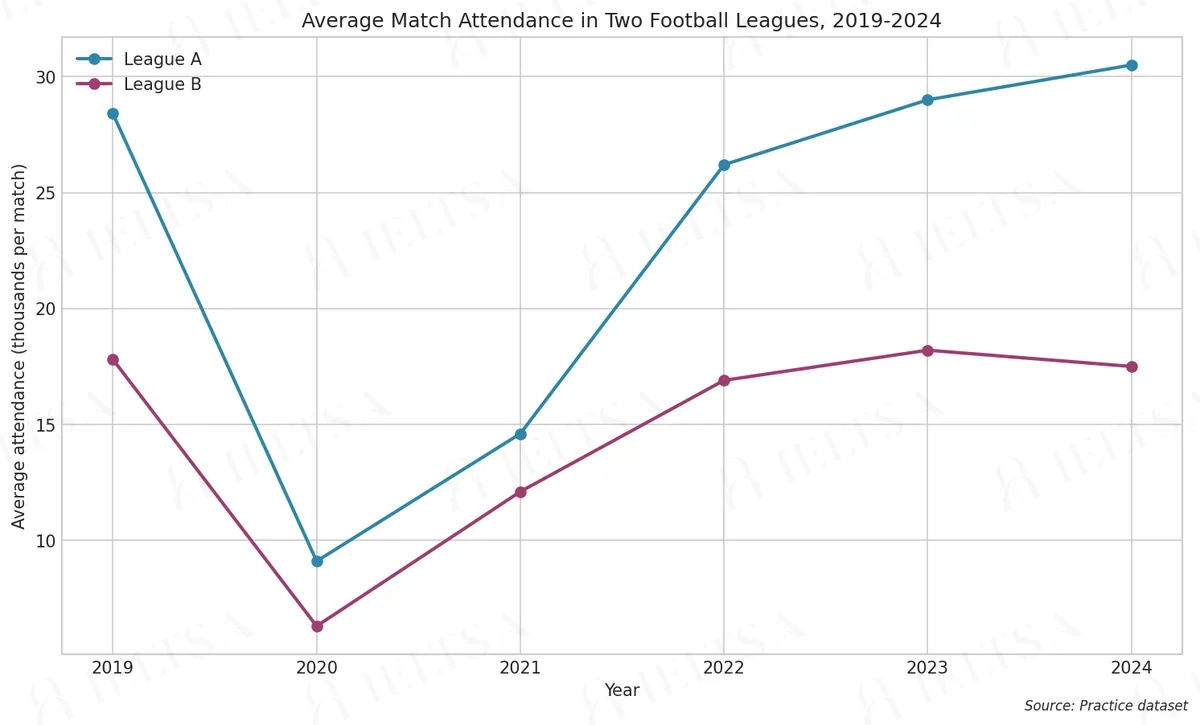
The line graph below shows the average attendance per match in two football leagues from 2019 to 2024. Summarise the information by selecting and reporting the main features, and make comparisons where relevant.
Write at least 150 words.
Instructions
You should spend about 20 minutes on this task.
• Begin with an overview of the main trends or differences.
• Compare the two leagues with each other, and note any year when the pattern changes.
• Use the figures shown on the chart where they help.
• Do not give your own opinions or speculate about causes.
How to approach this line graph question
A line graph shows change over time. Your job is to describe the trends and compare the lines, not to list every point.
- Paraphrase the question, giving the time span and units.
- Overview: the overall direction of each line and where they cross or finish.
- Describe each trend with a range of verbs (rose steadily, fell sharply, levelled off) and time markers.
- Mention the highest points, lowest points and any crossover.
How to plan this answer
Structure
- Introduction: paraphrase the line graph, which shows average match attendance in two football leagues from 2019 to 2024, in thousands per match.
- Overview: both leagues fall sharply in 2020 and then recover, League A ends above its 2019 level, League B ends just below it, and League A is consistently higher.
- Body paragraph 1: League A, from 28.4 thousand in 2019 down to 9.1 thousand in 2020 and up to 30.5 thousand in 2024.
- Body paragraph 2: League B, from 17.8 thousand in 2019 down to 6.3 thousand in 2020, then up to 18.2 thousand in 2023 and back down to 17.5 thousand in 2024.
Key features to spot
- In 2020 League A's attendance falls by 19.3 thousand, from 28.4 to 9.1, and League B's falls by 11.5 thousand, from 17.8 to 6.3, roughly two-thirds in each case.
- League A is above its 2019 level by 2023 (29.0) and reaches 30.5 in 2024, a gain of 2.1 thousand on 2019.
- League B reaches 18.2 thousand in 2023, slightly above its 2019 figure, but falls back to 17.5 thousand in 2024.
- In 2024 the two leagues move in different directions: League A rises while League B falls.
- The gap between the two leagues widens from 10.6 thousand in 2019 to 13.0 thousand in 2024.
Useful vocabulary
- plummeted: Attendance in League A plummeted in 2020.
- bounced back: Both leagues bounced back in the following years.
- recovered to: League A recovered to 26.2 thousand by 2022.
- fell to a low of: League B fell to a low of 6.3 thousand in 2020.
- the gap widened: The gap between the two leagues widened after 2023.
- surpassed: League B surpassed its 2019 figure in 2023.
- peaked at: League A peaked at 30.5 thousand in 2024.
- thousand per match: Average attendance was 30.5 thousand per match in League A in 2024.
Common mistakes
- Describing the 2020 fall as a slight dip, when both leagues lost roughly two-thirds of their attendance.
- Saying League B never recovered, when it passed its 2019 figure in 2023.
- Reading the figures as whole numbers, when 28.4 means 28,400 spectators per match.
- Missing the 2024 divergence, where League A rises while League B falls.
- Naming a cause for the 2020 fall, such as a global event, which the prompt rules out.
Examiner tip: Dramatic dips and recoveries need precise figures compared with the starting year. Note the single year in which the two lines move in different directions.
Model answers by band score
Written for this question to show what changes from one band to the next. Try the task yourself first, then compare.
Band 6 answer
The line graph show the average attendance per match in two football leagues, League A and League B, from 2019 to 2024.
In general, League A have more people at the matches than League B in every year. Both leagues were affected in 2020 and then they went up again.
In 2019, League A had 28.4 thousand people and League B had 17.8 thousand. In 2020 the attendance fell very much in both leagues. League A went down to 9.1 thousand and League B went down to 6.3 thousand. After that, the numbers increased in 2021, to 14.6 thousand and 12.1 thousand.
In 2022, League A reached 26.2 thousand and League B reached 16.9. League A continued to grow to 29.0 in 2023 and 30.5 in 2024. However, League B was different, because it went up to 18.2 in 2023 but then went down a little to 17.5 in 2024. So the gap between the two leagues is bigger at the end.
Why this is band 6
- Relevant overview with the main pattern (League A always higher, both dropped then recovered), and data is accurate.
- Range is limited: 'went up' and 'went down' repeat, and some units are missing ('16.9').
- Errors such as 'The line graph show', 'League A have' and 'fell very much' are noticeable but do not stop the reader understanding.
- Band 7 would vary the trend vocabulary, name the 2020 low as the key feature in the overview and cut the year-by-year listing.
Band 7 answer
The line graph compares average match attendance, in thousands, at two football leagues between 2019 and 2024.
Overall, League A attracted bigger crowds than League B throughout the period. Both leagues experienced a sharp fall in 2020 followed by a recovery, but only League A finished the period well above its starting level.
In 2019, League A averaged 28.4 thousand spectators, compared with 17.8 thousand for League B. Attendance then plunged in 2020 to 9.1 thousand and 6.3 thousand respectively, before climbing to 14.6 thousand and 12.1 thousand in 2021.
From 2022 onwards the two leagues followed different paths. League A rose steadily, from 26.2 thousand in 2022 to 29.0 thousand in 2023 and a high of 30.5 thousand in 2024. League B, by contrast, recovered to 16.9 thousand in 2022 and peaked at 18.2 thousand in 2023, but slipped to 17.5 thousand in 2024, slightly below its 2019 figure.
Why this is band 7
- Clear overview identifying the shared dip, the recovery and the difference in where each league ended.
- Well organised in a logical time sequence, with a useful contrast marker ('by contrast') and accurate figures with units.
- Good range of trend verbs: 'plunged', 'climbing', 'peaked', 'slipped'.
- Band 8 would add comparative analysis, such as the size of the gap between leagues, rather than listing most values.
Band 8 answer
The line graph compares average attendance per match, in thousands, in two football leagues between 2019 and 2024.
Overall, League A drew larger crowds than League B in every year. Both leagues suffered a steep fall in 2020 and then recovered, but while League A went on to set a new high by 2024, League B ended slightly below its pre-fall level.
League A began at 28.4 thousand and collapsed to 9.1 thousand in 2020, a loss of roughly two-thirds. League B dropped from 17.8 thousand to 6.3 thousand over the same year. Both then rebounded, reaching 14.6 thousand and 12.1 thousand respectively in 2021.
The recovery then diverged. League A passed its 2019 level in 2023, at 29.0 thousand, and continued to 30.5 thousand in 2024. League B, however, levelled off at around 17 to 18 thousand from 2022, peaking at 18.2 thousand in 2023 before easing to 17.5 thousand. As a result, the gap between the two leagues widened from 10.6 thousand in 2019 to 13.0 thousand in 2024.
Why this is band 8
- The overview contrasts the final outcomes of both leagues, not just the shared pattern.
- Selective use of data and calculated comparisons (a loss of 'roughly two-thirds', the gap widening from 10.6 to 13.0 thousand), all accurate.
- Flexible, precise language ('collapsed', 'rebounded', 'diverged', 'levelled off') with natural linking.
- Band 9 would present these ideas more economically and with total naturalness, with no slightly mechanical sequencing.
Band 9 answer
The line graph tracks average attendance per match, in thousands, at two football leagues from 2019 to 2024.
Overall, League A consistently drew the bigger crowds. Both leagues were hit hard in 2020 and recovered thereafter, yet League A ultimately surpassed its starting point whereas League B did not quite regain its original level.
In 2019 League A averaged 28.4 thousand spectators against 17.8 thousand for League B. Attendance then collapsed in 2020, to 9.1 thousand and 6.3 thousand respectively, with League A losing around two-thirds of its crowd and League B roughly 65 per cent. A partial rebound followed in 2021, to 14.6 thousand and 12.1 thousand.
From 2022 the paths diverged. League A rose in each successive year, from 26.2 thousand to 29.0 thousand and finally 30.5 thousand, its highest figure in the period. League B, by contrast, plateaued, edging up to 18.2 thousand in 2023 before slipping to 17.5 thousand, marginally under its 2019 mark. Consequently, the difference between the two grew from 10.6 thousand in 2019 to 13.0 thousand in 2024.
Why this is band 9
- Overview is complete and sophisticated: it handles consistent ranking, shared shock and differing outcome in two sentences.
- Every figure and derived percentage is accurate (League A lost about two-thirds, League B about 65 per cent; the gap grew 10.6 to 13.0).
- Fully natural, precise lexis ('plateaued', 'edging up', 'marginally under its 2019 mark') with seamless cohesion.
- Essentially error-free, and the detail is selected to tell the story rather than to list every point.
Band levels are our estimate against the public IELTS criteria; they are not official scores.
Write your answer
Sign in with Google to write online and get 8 free answers marked each month against the IELTS band criteria. No card, no password.
Sign in with Google to writeMore practice questions
Practise all four IELTS skills
Listening, Reading, Writing and Speaking with band 8 samples at ieltsa.org.