Age at First Marriage
The question
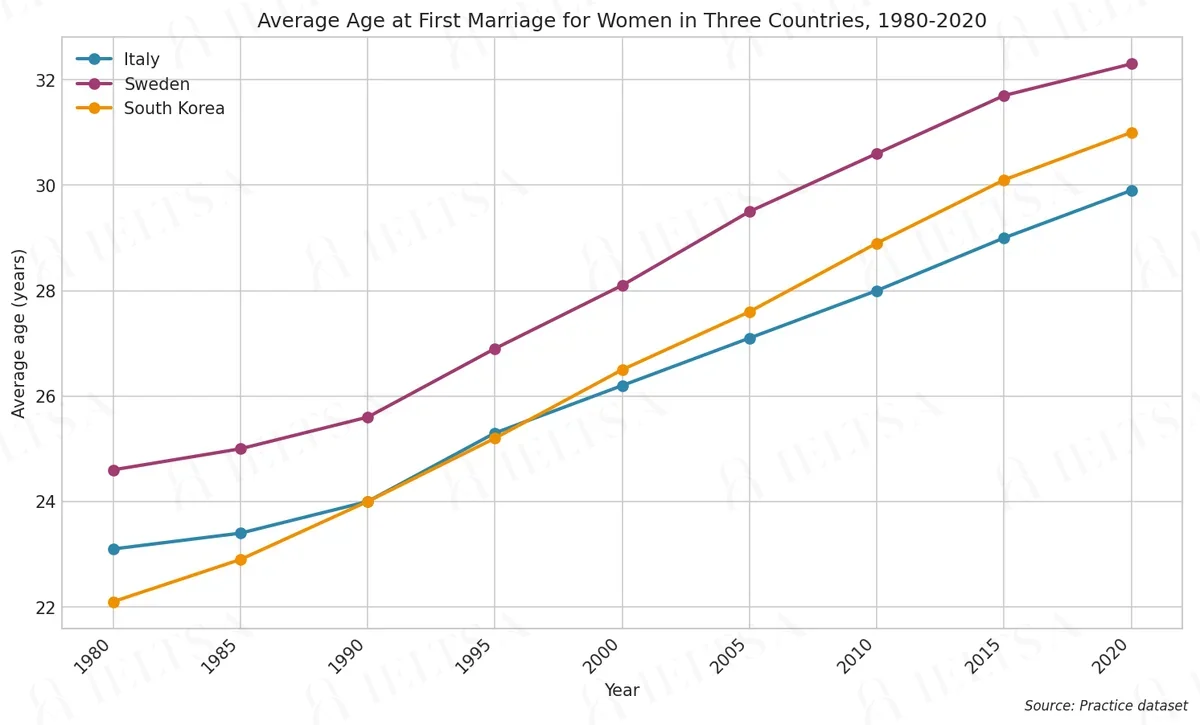
The line graph below shows the average age at which women first married in three countries between 1980 and 2020. Summarise the information by selecting and reporting the main features, and make comparisons where relevant.
Write at least 150 words.
Instructions
You should spend about 20 minutes on this task.
• Begin with an overview of the main trends or differences.
• Compare the three countries with each other as well as over time.
• Use the figures and units shown on the chart where they help.
• Do not give your own opinions or speculate about causes.
How to approach this line graph question
A line graph shows change over time. Your job is to describe the trends and compare the lines, not to list every point.
- Paraphrase the question, giving the time span and units.
- Overview: the overall direction of each line and where they cross or finish.
- Describe each trend with a range of verbs (rose steadily, fell sharply, levelled off) and time markers.
- Mention the highest points, lowest points and any crossover.
How to plan this answer
Structure
- Introduction: paraphrase the graph. Average age at which women first married in Italy, Sweden and South Korea, 1980 to 2020.
- Overview: all three figures rose steadily, Sweden had the highest figure throughout, and South Korea rose the most.
- Body 1: Sweden (24.6 to 32.3) and Italy (23.1 to 29.9), with the widening gap between them.
- Body 2: South Korea, which began lowest in 1980, overtook Italy around 2000 and ended at 31.0 years.
Key features to spot
- Sweden had the highest average age throughout, rising from 24.6 years in 1980 to 32.3 years in 2020.
- South Korea rose the most, from 22.1 years to 31.0 years, an increase of almost nine years.
- Italy rose from 23.1 to 29.9 years, a smaller increase of 6.8 years.
- South Korea was below Italy in 1995 (25.2 against 25.3) but above it in 2000 (26.5 against 26.2) and afterwards.
- The gap between Sweden and Italy widened from 1.5 years in 1980 to 2.4 years in 2020.
Useful vocabulary
- the average age at which women first married: The line graph shows the average age at which women first married.
- rose steadily: The figure for Italy rose steadily throughout the period.
- climbed from ... to ...: South Korea climbed from 22.1 years to 31.0 years.
- overtook: South Korea overtook Italy around 2000.
- remained the highest: Sweden remained the highest of the three countries in every year.
- the gap widened: The gap between Sweden and Italy widened to 2.4 years by 2020.
- increased by almost nine years: The average age in South Korea increased by almost nine years.
- by the end of the period: By the end of the period, Sweden stood at 32.3 years.
- the lowest starting point: South Korea had the lowest starting point in 1980.
- a continuous upward trend: All three countries show a continuous upward trend.
Common mistakes
- Saying South Korea was always the lowest. It overtook Italy around 2000, so the ranking changed.
- Quoting values for every year. Choose the key points, the start and end figures and the crossover, to keep the report concise.
- Forgetting the unit. Give the figures as years, for example 24.6 years, not just 24.6.
- Saying the increase in South Korea was nine years. The exact increase is 8.9 years, so almost nine years is accurate.
- Describing the trend as a fall in some years. Each line rises in every period shown.
Examiner tip: Describe the lines as a group first, then explain the one crossover between South Korea and Italy, which is the most distinctive feature of this graph.
Model answers by band score
Written for this question to show what changes from one band to the next. Try the task yourself first, then compare.
Band 6 answer
The line graph show the average age of women when they get married for the first time in Italy, Sweden and South Korea from 1980 to 2020.
Overall, the age go up in all three countries during the period. Sweden has the highest age and Italy has the lowest at the end.
In 1980, the age in Italy was 23.1, in Sweden it was 24.6 and in South Korea it was 22.1. After that the numbers rises slowly in the all countries. In 1990 Italy and South Korea were the same, at 24.0 years, and Sweden was a bit higher at 25.6.
By 2020, Sweden reached 32.3 years, South Korea reached 31.0 years and Italy reached 29.9 years. South Korea grew very fast and it became higher than Italy around the year 2000. South Korea had the biggest increase, about 9 years, but Italy had the smallest increase. The age in Sweden was always the highest in the graph.
Why this is band 6
- Relevant overview that says all three ages rose and Sweden was highest, with correct starting and ending figures.
- Language is simple and repetitive ('reached ... years' three times) with errors such as 'The line graph show', 'age go up' and 'in the all countries'.
- Some detail is approximate ('about 9 years', 'around the year 2000'); the comparison is correct in outline but lacks the precision of a stronger answer.
- Band 7 would give a clearer overview that includes South Korea's overtaking of Italy, group the data more logically and use more varied linking and fewer errors.
Band 7 answer
The line graph compares the average age at which women first married in Italy, Sweden and South Korea between 1980 and 2020.
Overall, the average age rose steadily in all three countries. Sweden remained the highest throughout, while South Korea saw the biggest increase and overtook Italy.
In 1980, women in South Korea married youngest, at 22.1 years, compared with 23.1 in Italy and 24.6 in Sweden. Over the next decade the three figures rose gradually, and South Korea and Italy both stood at 24.0 in 1990, while Sweden was higher at 25.6.
Between 1995 and 2000, South Korea moved ahead of Italy: its figure was 26.5 in 2000 compared with 26.2 for Italy, and the gap widened to 1.1 years in 2020, when the figures were 31.0 and 29.9. Sweden's average climbed from 24.6 to 32.3, the highest point on the graph. South Korea therefore rose by 8.9 years overall, more than Sweden (7.7) and Italy (6.8).
Why this is band 7
- Overview states the common upward trend, Sweden's constant lead and South Korea's overtaking of Italy, so the main features are clear.
- Good organisation: starting positions, the 1990 convergence, then the end of the period, with accurate figures throughout.
- The overtaking is dated correctly (between 1995 and 2000) and the end-of-period gap of 1.1 years is accurate, though the answer does not mention that Sweden's rise slowed.
- Band 8 would pinpoint the overtaking exactly and use more flexible, economical wording rather than repeating 'figure' and 'compared with'.
Band 8 answer
The line graph shows the average age at which women first married in Italy, Sweden and South Korea at five-year intervals from 1980 to 2020.
Overall, the age rose consistently in every country. Sweden stayed highest throughout, but South Korea showed the steepest increase, moving from the lowest position to second place.
In 1980 South Korean women married youngest, at 22.1 years, while Italian and Swedish women averaged 23.1 and 24.6 respectively. South Korea and Italy were level at 24.0 in 1990, and the two lines almost touched in 1995 (25.2 against 25.3). After that, South Korea pulled ahead, reaching 26.5 in 2000 against Italy's 26.2.
By 2020 Sweden's average had reached 32.3, just ahead of the South Korean 31.0, with Italy trailing at 29.9. In total, South Korea's figure climbed by 8.9 years, compared with 7.7 for Sweden and 6.8 for Italy. Sweden's rise was also the most gradual in later years, increasing by only 0.6 between 2015 and 2020, compared with 0.9 in Italy and South Korea.
Why this is band 8
- Overview combines the shared trend, the constant leader and the change in ranking, and it is accurate.
- Detail is well chosen: the 1995 near-crossing (25.2 against 25.3) and the 2000 overtaking are precisely located and correct.
- Calculated rises (8.9, 7.7, 6.8 years) and the 2015-2020 comparison (0.6 against 0.9) are accurate and show control of the data.
- Band 9 would express the same insights with still more natural economy; some sentences ('Sweden's rise was also the most gradual in later years') are slightly clumsy.
Band 9 answer
The line graph tracks the average age at which women first married in Italy, Sweden and South Korea over four decades, from 1980 to 2020.
Overall, the age climbed steadily in all three countries. Sweden remained the highest throughout, whereas South Korea, starting as the youngest, rose most steeply and ended above Italy.
South Korean women married at 22.1 in 1980, a year or so earlier than Italian women (23.1) and 2.5 years earlier than Swedish women (24.6). By 1990 South Korea had drawn level with Italy at 24.0, and the two stayed within a tenth of a year in 1995 (25.2 against 25.3) before South Korea edged ahead in 2000, with 26.5 against 26.2.
The gap then widened: in 2020 the figures were 31.0 for South Korea and 29.9 for Italy. Sweden, meanwhile, never lost its lead, reaching 32.3 after a slightly slower final stretch, with a rise of only 0.6 between 2015 and 2020. Over the full period South Korea's average rose by 8.9 years, outpacing Sweden's 7.7 and Italy's 6.8, so that the three countries ended the period 2.4 years apart, against 2.5 at its start.
Why this is band 9
- The overview is complete and fluent: shared trend, constant leader, and the change in the relative position of South Korea and Italy.
- Every figure is correct, including the 1995 near-tie and the final spread (32.3 minus 29.9 is 2.4, against 2.5 in 1980), which shows an unusually precise reading of the data.
- Vocabulary and structures are natural and varied ('drawn level', 'edged ahead', 'outpacing') with no errors.
- Paragraph structure follows time, and each paragraph has a clear job, so the report reads as a seamless whole.
Band levels are our estimate against the public IELTS criteria; they are not official scores.
Write your answer
Sign in with Google to write online and get 8 free answers marked each month against the IELTS band criteria. No card, no password.
Sign in with Google to writeMore practice questions
Practise all four IELTS skills
Listening, Reading, Writing and Speaking with band 8 samples at ieltsa.org.