Bus Occupancy Across a Weekday
The question
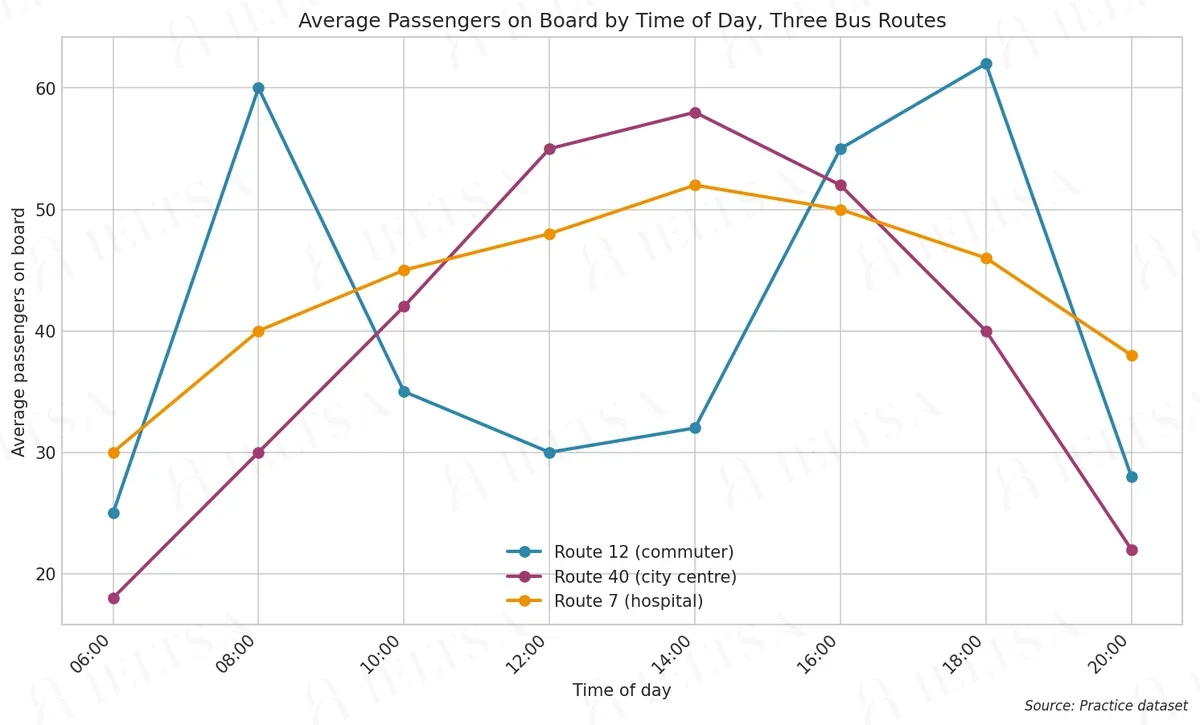
The line graph below shows the average number of passengers on board three bus routes at different times of a weekday in one city. Summarise the information by selecting and reporting the main features, and make comparisons where relevant.
Write at least 150 words.
Instructions
You should spend about 20 minutes on this task.
• Begin with an overview of the main trends or differences.
• Compare the routes at different times of day, noting where the lines cross.
• Use the figures shown on the chart where they help.
• Do not give your own opinions or speculate about causes.
How to approach this line graph question
A line graph shows change over time. Your job is to describe the trends and compare the lines, not to list every point.
- Paraphrase the question, giving the time span and units.
- Overview: the overall direction of each line and where they cross or finish.
- Describe each trend with a range of verbs (rose steadily, fell sharply, levelled off) and time markers.
- Mention the highest points, lowest points and any crossover.
How to plan this answer
Structure
- Introduction: paraphrase the line graph, which shows the average number of passengers on board three bus routes at different times of a weekday.
- Overview: Route 12 has the sharpest peaks, Route 7 is the most stable, and Route 40 peaks around midday; the lines cross several times.
- Body paragraph 1: Route 12 (commuter) and Route 40 (city centre), covering their morning and evening peaks and the afternoon crossover.
- Body paragraph 2: Route 7 (hospital), its narrow range, and where its line crosses Route 40 in the morning and evening.
Key features to spot
- Route 12 peaks at 62 passengers at 18:00 and at 60 at 08:00, but falls to 25 at 06:00 and 28 at 20:00.
- Route 40 rises through the day to a peak of 58 at 14:00 before falling to 22 by 20:00.
- Route 7 has the narrowest range, from 30 to 52, against 37 for Route 12 and 40 for Route 40.
- Route 40 overtakes Route 12 between 08:00 and 10:00 (42 against 35 at 10:00), and Route 12 overtakes it again between 14:00 and 16:00.
- Route 7 is ahead of Route 40 at 06:00 to 10:00 and at 18:00 to 20:00, but behind it from 12:00 to 16:00.
Useful vocabulary
- peaked at: Route 12 peaked at 62 passengers at 18:00.
- reached a low of: Route 40 reached a low of 18 passengers at 06:00.
- remained relatively stable: Route 7 remained relatively stable through the day.
- the widest range: Route 40 shows the widest range of the three routes.
- overtook: Route 40 overtook Route 12 in the mid-morning.
- crossed over: The two lines crossed over twice during the afternoon.
- the morning peak: Route 12 has a clear morning peak at 08:00.
- the evening peak: The evening peak on Route 12 comes at 18:00.
Common mistakes
- Describing the chart as one bus route rather than three separate routes.
- Saying Route 40 peaks in the evening, when its highest figure is at 14:00.
- Missing the second crossover between 14:00 and 16:00, or saying Route 40 stays ahead all afternoon.
- Calling Route 7 the busiest route all day, when it is ahead of Route 40 only at some times.
- Speculating about why commuter and hospital routes have different patterns, which the prompt rules out.
Examiner tip: Where lines cross, name the two time points between which the change happens, and say which route is ahead before and after the crossing.
Write your answer
Sign in with Google to write online and get 8 free answers marked each month against the IELTS band criteria. No card, no password.
Sign in with Google to writeMore practice questions
Practise all four IELTS skills
Listening, Reading, Writing and Speaking with band 8 samples at ieltsa.org.