Data Centre Electricity Use by Region
The question
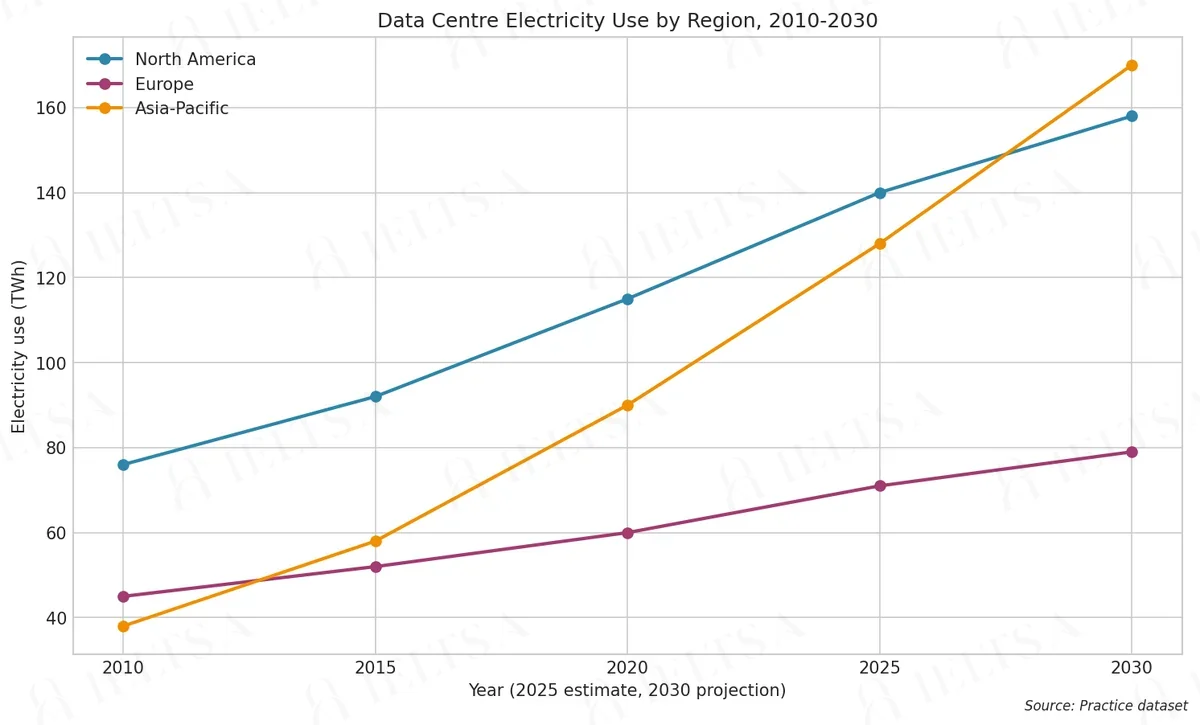
The line graph below shows the estimated and projected electricity use of data centres in three regions between 2010 and 2030. Summarise the information by selecting and reporting the main features, and make comparisons where relevant.
Write at least 150 words.
Instructions
You should spend about 20 minutes on this task.
• Begin with an overview of the main trends or differences.
• Compare the regions with each other, and note when the ranking changes.
• Use the figures and units shown on the chart where they help.
• Do not give your own opinions or speculate about causes.
How to approach this line graph question
A line graph shows change over time. Your job is to describe the trends and compare the lines, not to list every point.
- Paraphrase the question, giving the time span and units.
- Overview: the overall direction of each line and where they cross or finish.
- Describe each trend with a range of verbs (rose steadily, fell sharply, levelled off) and time markers.
- Mention the highest points, lowest points and any crossover.
How to plan this answer
Structure
- Introduction: paraphrase the line graph, which shows estimated and projected electricity use (TWh) by data centres in three regions from 2010 to 2030.
- Overview: use rises in all three regions, Asia-Pacific grows fastest and overtakes North America by 2030, and Europe is the lowest after 2010.
- Body paragraph 1: North America and Europe, with their rises from 76 to 158 TWh and from 45 to 79 TWh, and North America's position at the top until 2025.
- Body paragraph 2: Asia-Pacific, which moves from the lowest figure in 2010 (38 TWh) to the highest in 2030 (170 TWh), including the crossover point.
Key features to spot
- Asia-Pacific's use rises from 38 TWh to 170 TWh, more than four and a half times its 2010 level.
- Asia-Pacific overtakes North America between 2025 (128 vs 140 TWh) and 2030 (170 vs 158 TWh), a change in ranking.
- North America's growth is largest between 2020 and 2025 (up 25 TWh) and slows to 18 TWh in the projected period.
- Europe rises steadily from 45 to 79 TWh and is the lowest region from 2015 onwards, after Asia-Pacific was lowest in 2010.
- The 2025 figure is an estimate and the 2030 figure a projection, so the answer should flag this difference.
Useful vocabulary
- terawatt-hours (TWh): Electricity use is measured in terawatt-hours (TWh).
- estimated: The 2025 figure is estimated rather than measured.
- projected to: Asia-Pacific's use is projected to reach 170 TWh by 2030.
- overtake: Asia-Pacific is set to overtake North America by 2030.
- more than quadrupled: Electricity use in Asia-Pacific more than quadrupled over the period.
- rose steadily: Use in Europe rose steadily throughout the period.
- lagged behind: Europe lagged behind the other two regions for most of the period.
- by the end of the period: By the end of the period, Asia-Pacific is the highest region.
Common mistakes
- Presenting the 2025 and 2030 figures as measured fact, without noting that one is an estimate and the other a projection.
- Saying Asia-Pacific overtook North America in 2025, when North America was still ahead (140 against 128 TWh).
- Claiming Europe was the lowest region in 2010; Asia-Pacific (38 TWh) was lower than Europe (45 TWh).
- Mixing up the line colours or the regions when describing the lines that cross.
- Explaining the growth through a particular technology, which the prompt rules out as speculation about causes.
Examiner tip: On a line graph with several series, name the two years between which the ranking changes and give the figures for both sides of the crossover.
Model answers by band score
Written for this question to show what changes from one band to the next. Try the task yourself first, then compare.
Band 6 answer
The line graph shows how much electricity data centres use in three regions, North America, Europe and Asia-Pacific, from 2010 to 2030.
Overall, the electricity use go up in all three regions. Asia-Pacific grows the fastest and it becomes the highest at the end, while Europe is the lowest from 2015 onwards.
In 2010, North America used the most electricity, about 76 TWh. It rise steadily to 115 TWh in 2020 and then 140 TWh in 2025. After that it reach 158 TWh in 2030. Europe was lower than North America, starting at 45 TWh and growing slowly to 79 TWh in 2030.
Asia-Pacific started at 38 TWh, which was the lowest of the three regions in 2010. But it grow very quickly, to 58 TWh in 2015 and 90 TWh in 2020. In 2025 it was 128 TWh, and by 2030 it is 170 TWh, so it become bigger than North America. Europe is the smallest region at the end.
Why this is band 6
- Clear overview that names the main trend (all rise, Asia-Pacific fastest) and so covers the task basics.
- Figures are mostly accurate (e.g. 76 TWh to 158 TWh), but the writing mostly lists numbers region by region with little comparison.
- Repeated verb patterns ('grows', 'rise', 'reach') and errors such as 'It rise' and 'it become' show limited grammatical control, though meaning stays clear.
- To reach Band 7, it would compare regions directly, say when the ranking changes (2015 and 2030) and control verb forms.
Band 7 answer
The line graph compares estimated and projected electricity consumption by data centres in North America, Europe and Asia-Pacific between 2010 and 2030, measured in terawatt-hours (TWh).
Overall, consumption rises in every region, but Asia-Pacific grows far more quickly than the others and is projected to overtake North America by 2030. Europe is the smallest consumer for most of the period.
North America began as the largest user at 76 TWh and climbed steadily to 140 TWh in 2025, before a projected rise to 158 TWh in 2030. Europe followed a similar but flatter pattern, increasing from 45 TWh to 71 TWh in 2025 and a projected 79 TWh by 2030.
Asia-Pacific started from the lowest figure, 38 TWh, but overtook Europe by 2015 (58 TWh against 52 TWh). Its growth then accelerated, reaching 90 TWh in 2020 and 128 TWh in 2025, which was still below North America's 140 TWh. However, the projection for 2030 shows Asia-Pacific at 170 TWh, ahead of North America's 158 TWh, so the ranking changes at the end of the period.
Why this is band 7
- Clear overview identifies the fastest grower and the projected overtaking, so the main trend is easy to find.
- Good selection of figures, including the 2015 crossover ('58 TWh against 52 TWh') and the 2025 gap before the 2030 reversal.
- Accurate, varied structures ('before a projected rise', 'which was still below') with very few slips.
- To reach Band 8, it would pick out the ranking changes more economically and use more precise comparative language, such as the size of the gaps.
Band 8 answer
The line graph illustrates estimated and projected electricity use by data centres in North America, Europe and Asia-Pacific from 2010 to 2030, in terawatt-hours (TWh).
Overall, demand rises in all three regions, yet Asia-Pacific expands by far the most and is projected to end the period as the largest consumer, displacing North America. Europe, by contrast, grows modestly and stays the smallest user from 2015 onwards.
North America led throughout the estimated years, climbing steadily from 76 TWh in 2010 to 140 TWh in 2025, with a projected figure of 158 TWh in 2030. Europe's increase was gentler, from 45 TWh to 71 TWh over the same fifteen years, and it is projected to reach 79 TWh.
Asia-Pacific's trajectory is the most striking. Starting below Europe at 38 TWh, it surpassed it by 2015 (58 TWh against 52 TWh) and then more than doubled to 128 TWh by 2025, narrowing the gap with North America to just 12 TWh. The 2030 projection of 170 TWh puts it 12 TWh ahead of North America's 158 TWh, so the ranking reverses in the final five years.
Why this is band 8
- The overview contrasts all three regions in one sentence ('expands by far the most', 'stays the smallest user from 2015 onwards').
- Detail is well chosen and accurate, e.g. the 2025 gap of 12 TWh (140 minus 128) and the reversal by 2030 (170 against 158).
- Flexible, natural phrasing ('displacing', 'more than doubled', 'narrowing the gap') with almost no errors.
- To reach Band 9, it would handle the contrast and the timing of both ranking changes with even greater economy and no padded phrases.
Band 9 answer
The line graph tracks estimated and projected electricity use by data centres in North America, Europe and Asia-Pacific between 2010 and 2030, measured in terawatt-hours (TWh).
Overall, consumption climbs in every region, but at sharply different speeds. Asia-Pacific, the smallest user in 2010, grows fastest and is projected to become the largest by 2030, whereas Europe remains the lowest from 2015 onwards.
North America began well ahead at 76 TWh and rose steadily to 140 TWh in 2025, with a further increase to 158 TWh forecast for 2030. Europe's path was flatter still: from 45 TWh in 2010 to 71 TWh in 2025, and a projected 79 TWh by the end.
The most dramatic change belongs to Asia-Pacific. Beginning at 38 TWh, it overtook Europe by 2015 (58 TWh against 52 TWh) and then more than tripled its 2010 figure to 128 TWh by 2025, only 12 TWh short of North America. The projection for 2030 reverses the order: 170 TWh for Asia-Pacific against 158 TWh for North America. That crossover, which falls between 2025 and 2030, is the only change at the top of the ranking.
Why this is band 9
- Fully natural, controlled overview that captures both the shared direction and the sharply different speeds.
- Every figure is accurate and purposeful: 38 to 128 TWh is more than a tripling, the 12 TWh gap is correct, and the crossover is dated precisely.
- Sophisticated, precise language ('The most dramatic change belongs to', 'reverses the order') with essentially no errors.
- Cohesion is seamless, using comparison and sequence rather than region-by-region listing.
Band levels are our estimate against the public IELTS criteria; they are not official scores.
Write your answer
Sign in with Google to write online and get 8 free answers marked each month against the IELTS band criteria. No card, no password.
Sign in with Google to writeMore practice questions
Practise all four IELTS skills
Listening, Reading, Writing and Speaking with band 8 samples at ieltsa.org.