Adult Smoking Rates in Four Regions
The question
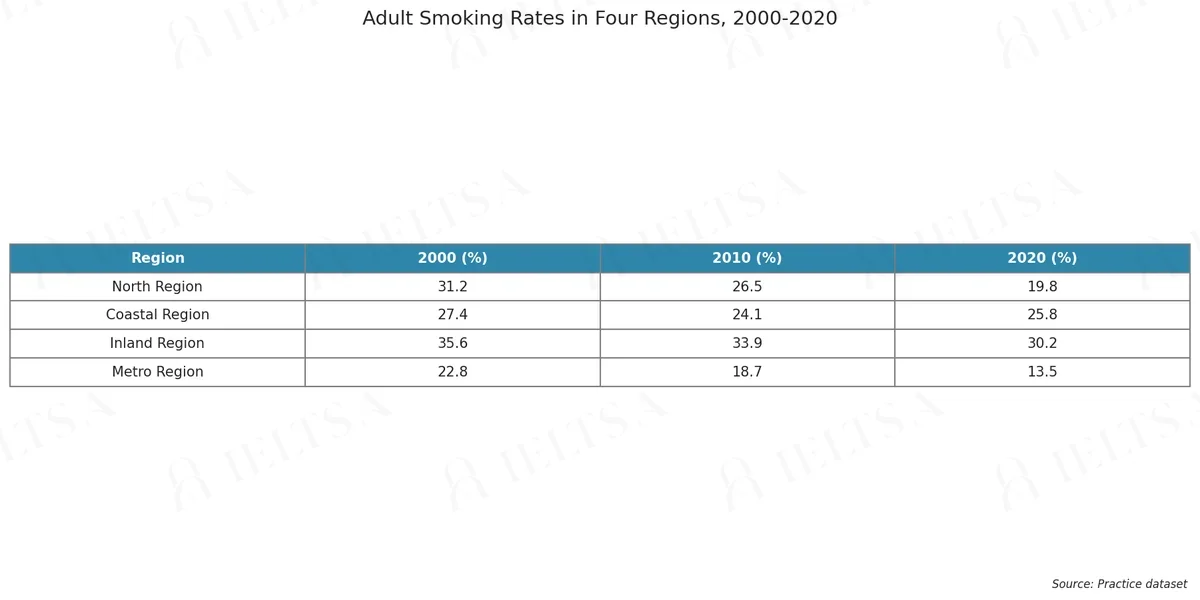
The table below shows the percentage of adults who smoked in four regions of Country B in 2000, 2010 and 2020. Summarise the information by selecting and reporting the main features, and make comparisons where relevant.
Write at least 150 words.
Instructions
You should spend about 20 minutes on this task.
• Begin with an overview of the main trends or differences.
• Compare the regions with each other as well as over time.
• Use the figures and units shown in the table where they help.
• Do not give your own opinions or speculate about causes.
How to approach this table question
A table packs many numbers into rows and columns. Select the features that matter instead of copying cells.
- Paraphrase the title and say what the rows and columns are.
- Overview: pick two or three clear patterns, such as the highest row and the biggest change.
- Group rows or columns that behave alike.
- Support each point with one or two figures and units.
How to plan this answer
Structure
- Introduction: paraphrase the table, which shows the percentage of adults who smoked in four regions of Country B in 2000, 2010 and 2020.
- Overview: smoking rates fell in three of the four regions over the period, Inland remained the highest and Metro the lowest, and Coastal was the only region to rise in the last decade.
- Body paragraph 1: the highest and lowest regions, Inland (35.6% to 30.2%) and Metro (22.8% to 13.5%), and how the gap between them changed.
- Body paragraph 2: North (31.2% to 19.8%) and Coastal (27.4% to 24.1%, then 25.8%), including the change in their ranking by 2020.
Key features to spot
- The North Region shows the steepest overall fall, from 31.2% to 19.8%, and it falls faster in the second decade (6.7 points) than the first (4.7 points).
- Coastal is the only region to rise in the last decade, from 24.1% to 25.8%, after falling from 27.4% in 2000.
- Inland is highest in every year, but its gap with Metro widens from 12.8 points in 2000 to 16.7 points in 2020.
- Metro is lowest in every year, falling from 22.8% to 13.5%, a fall of over 40% of its starting level.
- By 2020 Coastal (25.8%) has overtaken North (19.8%) to become the second-highest region, a change in ranking.
Useful vocabulary
- the proportion of adults who smoked: The table shows the proportion of adults who smoked in each region.
- fell by ... percentage points: The North Region fell by 11.4 percentage points over the period.
- consistently the highest: Inland was consistently the highest region.
- bucked the trend: Coastal bucked the trend by rising after 2010.
- a slight rise: Coastal recorded a slight rise between 2010 and 2020.
- the gap widened: The gap between Inland and Metro widened over time.
- overtook: Coastal overtook North to become the second-highest region by 2020.
- a steady decline: Metro shows a steady decline in each period.
Common mistakes
- Saying all four regions fell steadily, when Coastal dipped and then rose after 2010.
- Confusing the 2020 ranking, placing North above Coastal when Coastal (25.8%) is higher than North (19.8%).
- Writing 'percent' for changes between two rates instead of percentage points.
- Quoting only the 2000 and 2020 values and missing the 2010 turning point for Coastal.
- Suggesting reasons for the fall in smoking, such as policy or health campaigns, which the prompt does not allow.
Examiner tip: Track both the trend and the ranking in each region. A table with three time points rewards noticing the one region that moves against the pattern.
Model answers by band score
Written for this question to show what changes from one band to the next. Try the task yourself first, then compare.
Band 6 answer
The table show the percentage of adults who smoked in four regions of Country B in 2000, 2010 and 2020.
Overall, the smoking rate went down in most of the regions in the twenty years. Inland Region has the highest rate and Metro Region has the lowest rate.
In 2000, Inland Region was the highest with 35.6%, and then North Region was 31.2%. Coastal Region was 27.4% and Metro Region was 22.8%. In 2010 all the regions went down. Inland was 33.9%, North was 26.5%, Coastal was 24.1% and Metro was 18.7%.
In 2020, North Region and Metro Region continued to go down, to 19.8% and 13.5%. Inland Region went down too, to 30.2%, but it was still the highest. Coastal Region is different from the others because it increased from 24.1% to 25.8%. So the Metro Region had the biggest change in the table, from 22.8% to 13.5%, and this is the main difference between the regions.
Why this is band 6
- Overview names the main points: general decrease, Inland highest, Metro lowest.
- Figures are correct, but the report mostly lists them year by year, so selection is weak.
- Repetition ('went down', 'was ... %') and errors ('The table show', 'Inland Region has') mark a limited range.
- 'The Metro Region had the biggest change' is wrong, since North fell by 11.4 points against Metro's 9.3. A band 7 answer would calculate comparisons correctly.
Band 7 answer
The table compares the proportion of adults who smoked in four regions of Country B in 2000, 2010 and 2020.
Overall, smoking became less common in three of the four regions over the period, with the only exception being Coastal Region, where the figure was higher in 2020 than in 2010. Inland Region had the highest rate throughout, while Metro Region had the lowest.
In 2000, the rate was highest in Inland Region (35.6%), followed by North Region (31.2%), Coastal Region (27.4%) and Metro Region (22.8%). By 2010, every region had recorded a decrease, with North Region falling most sharply to 26.5%.
By 2020, the rates in North and Metro Regions had fallen further, to 19.8% and 13.5% respectively, and Inland Region had declined slightly to 30.2%. Coastal Region, however, rose from 24.1% to 25.8%, which meant that it overtook North Region as the second-highest. Overall, North Region showed the biggest decline, at 11.4 percentage points.
Why this is band 7
- Clear overview that identifies the general fall, the exception (Coastal) and the highest and lowest regions.
- Logical grouping by year, with accurate figures and a correct calculation of the biggest decline (11.4 points).
- Good range: 'recorded a decrease', 'declined slightly', 'overtook', with accurate linking.
- Band 8 would compare regions more selectively instead of repeating all values, and use more varied phrasing.
Band 8 answer
The table shows the percentage of adults who smoked in four regions of Country B in 2000, 2010 and 2020.
Overall, smoking declined in all regions between 2000 and 2020, although Coastal Region bucked the trend after 2010. Inland Region consistently recorded the highest rate, while Metro Region remained the lowest throughout.
Inland Region began at 35.6% and, despite a gradual fall to 30.2%, stayed well ahead of the others. Its decline of 5.4 points was the smallest of the four. North Region fell much faster, from 31.2% to 19.8%, the steepest drop at 11.4 points, and Metro Region declined from 22.8% to 13.5%.
Coastal Region followed a different course. Its rate dropped from 27.4% to 24.1% by 2010 but then edged back up to 25.8% in 2020, making it the only region to register an increase in the later decade. This reversed the order of Coastal and North Regions, since North had been higher in both 2000 and 2010. The gap between Inland and Metro Regions widened from 12.8 to 16.7 points.
Why this is band 8
- Precise overview that notes the general decline and the exception, naming the highest and lowest regions.
- Selective, analytical detail (smallest and steepest falls, the change in ranking, the widening gap) with accurate figures.
- Flexible language ('bucked the trend', 'edged back up', 'reversed the order') and natural cohesion.
- Band 9 would be even more economical and fully seamless, with no minor repetition of 'Region'.
Band 9 answer
The table shows the percentage of adults who smoked in four regions of Country B in 2000, 2010 and 2020.
Overall, smoking prevalence fell in every region across the twenty years, though Coastal Region departed from the pattern by recording a rise after 2010. Inland Region had the highest rate at each date, and Metro Region the lowest.
The decline was uneven. North Region saw the steepest fall, from 31.2% to 19.8% (11.4 points), and Metro Region's rate dropped from 22.8% to 13.5%. Inland Region, by contrast, proved far more resistant, easing only from 35.6% to 30.2%, so that nearly a third of its adults were still smoking in 2020.
Coastal Region followed a distinctive course. After slipping from 27.4% to 24.1% by 2010, it edged up to 25.8% in 2020, the only increase in the table. That uptick allowed it to overtake North Region, which had been higher in both earlier years. The spread between the highest and lowest regions therefore widened, from 12.8 points in 2000 to 16.7 in 2020.
Why this is band 9
- Overview is complete and nuanced, covering the general decline, the exception and the extremes without listing.
- All figures and calculations are exact (11.4, 12.8 and 16.7 points) and are used to interpret the data.
- Highly natural and precise language ('prevalence', 'resistant', 'uptick') with seamless cohesion between paragraphs.
- Essentially error-free, and it stays within the no-speculation instruction.
Band levels are our estimate against the public IELTS criteria; they are not official scores.
Write your answer
Sign in with Google to write online and get 8 free answers marked each month against the IELTS band criteria. No card, no password.
Sign in with Google to writeMore practice questions
Practise all four IELTS skills
Listening, Reading, Writing and Speaking with band 8 samples at ieltsa.org.