Rents and Home Prices in Four Cities
The question
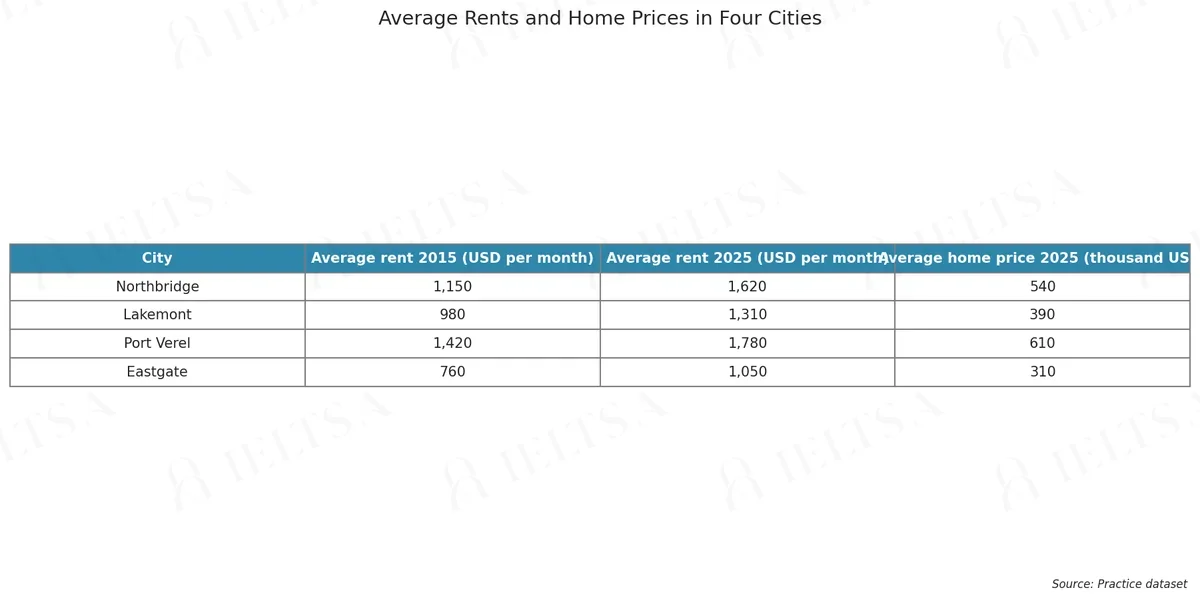
The table below shows average monthly rents in four cities in 2015 and 2025, and average home prices in 2025. Summarise the information by selecting and reporting the main features, and make comparisons where relevant.
Write at least 150 words.
Instructions
You should spend about 20 minutes on this task.
• Begin with an overview of the main trends or differences.
• Compare the cities on rent in both years and on home prices, and note which city changed most.
• Use the figures and units shown in the table where they help.
• Do not give your own opinions or speculate about causes.
How to approach this table question
A table packs many numbers into rows and columns. Select the features that matter instead of copying cells.
- Paraphrase the title and say what the rows and columns are.
- Overview: pick two or three clear patterns, such as the highest row and the biggest change.
- Group rows or columns that behave alike.
- Support each point with one or two figures and units.
How to plan this answer
Structure
- Introduction: paraphrase the table, which shows average monthly rents in four cities in 2015 and 2025 and average home prices in 2025.
- Overview: Port Verel has the highest rents in both years and the highest home prices, Eastgate the lowest on every measure, and rents rise in all four cities.
- Body paragraph 1: rent changes from 2015 to 2025, comparing the largest rise in dollars (Northbridge) with the smallest rise in percentage terms (Port Verel).
- Body paragraph 2: home prices in 2025 and how they follow the same order as rents, with Eastgate the cheapest city.
Key features to spot
- Northbridge shows the largest rise in dollars, up 470 USD per month from 1,150 to 1,620 (about 41%).
- Port Verel's rent rises by 360 USD but only about 25%, the smallest percentage rise, though it stays the most expensive city for rent in 2025 (1,780 USD).
- Eastgate's rent rises by about 38%, from 760 to 1,050 USD per month, while staying the cheapest in both years.
- Home prices in 2025 follow the same order as rents: Port Verel (610k), Northbridge (540k), Lakemont (390k) and Eastgate (310k).
- Rents are in USD per month, while home prices are in thousand USD, so the units should not be mixed.
Useful vocabulary
- monthly rent: Average monthly rent in Eastgate rose to 1,050 USD in 2025.
- USD per month: Rents in Lakemont were 1,310 USD per month in 2025.
- rose by ... to ...: Rent in Northbridge rose by 470 USD to 1,620 USD.
- the largest increase in absolute terms: Northbridge recorded the largest increase in absolute terms.
- in percentage terms: In percentage terms, Eastgate's rise is larger than Port Verel's.
- the most expensive: Port Verel is the most expensive city for both rent and home prices.
- the cheapest: Eastgate is the cheapest city on every measure.
- home prices stood at: Average home prices in Lakemont stood at 390 thousand USD.
Common mistakes
- Saying Port Verel had the largest rent increase in dollars, when Northbridge's rise (470 USD) is larger than Port Verel's (360 USD).
- Calling Port Verel the city whose rent rose most in percentage terms, when its rise is the smallest of the four.
- Mixing the units, for example giving home prices in USD per month or rents in thousands.
- Inventing 2015 home prices, which the table does not provide.
- Describing only one measure, rather than covering both the dollar and percentage changes that answer 'which city changed most'.
Examiner tip: Keep rents and home prices in separate sentences and check the units each time. Calculate the percentage change for the biggest and smallest movers, so your comparisons are accurate.
Write your answer
Sign in with Google to write online and get 8 free answers marked each month against the IELTS band criteria. No card, no password.
Sign in with Google to writeMore practice questions
Practise all four IELTS skills
Listening, Reading, Writing and Speaking with band 8 samples at ieltsa.org.