IELTS Academic Writing Task 1: Technology Adoption Rates Table
The question
The table below illustrates the percentage of households in a developed country owning or subscribing to five different smart technologies from 2010 to 2023.
Summarise the information by selecting and reporting the main features, and make comparisons where relevant.
Write at least 150 words.
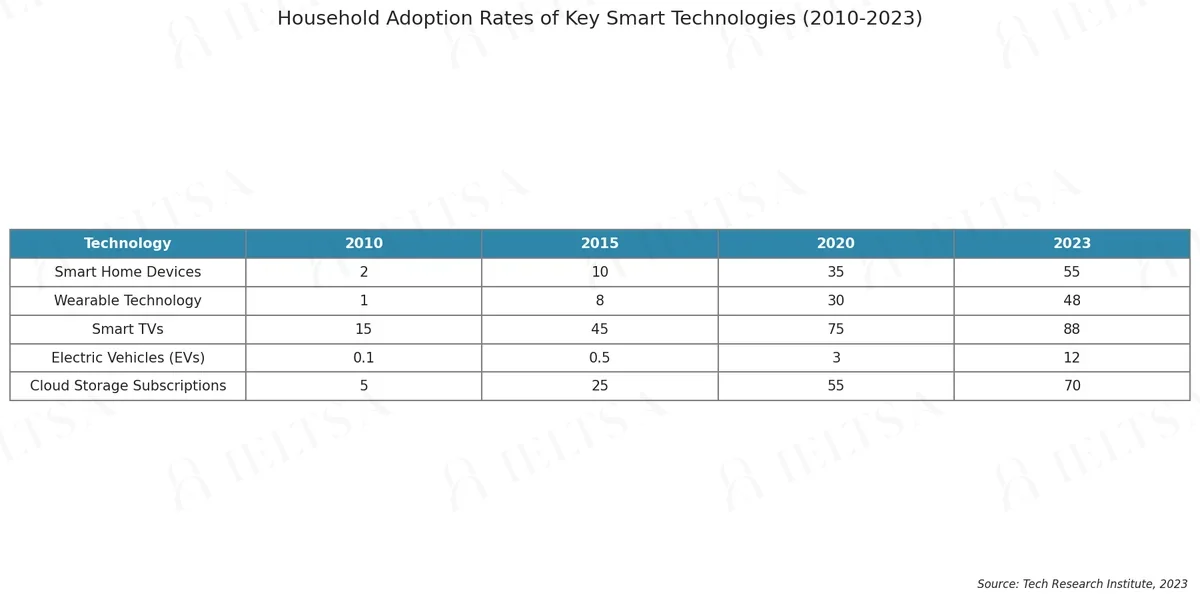
Instructions
The table below shows the percentage of households in a developed country owning or subscribing to five different smart technologies from 2010 to 2023. Summarise the information by selecting and reporting the main features, and make comparisons where relevant. Write at least 150 words.
How to approach this table question
A table packs many numbers into rows and columns. Select the features that matter instead of copying cells.
- Paraphrase the title and say what the rows and columns are.
- Overview: pick two or three clear patterns, such as the highest row and the biggest change.
- Group rows or columns that behave alike.
- Support each point with one or two figures and units.
How to plan this answer
Structure
- Overview: one sentence stating that all five technologies grew in every period, with smart TVs the most widely adopted and electric vehicles the least.
- Body 1: smart TVs and cloud storage subscriptions, the two most widely adopted technologies, with their 2010 and 2023 figures.
- Body 2: smart home devices and wearable technology, which started low and grew sharply, especially after 2015.
- Body 3: electric vehicles, which started at 0.1 per cent and grew the fastest in relative terms, though they remained the least common in every year.
Key features to spot
- Smart TVs were the most widely adopted technology in every year, rising from 15 per cent in 2010 to 88 per cent in 2023.
- Smart TVs tripled between 2010 and 2015, from 15 to 45 per cent, the fastest rise of any technology in that period.
- Cloud storage subscriptions rose from 5 per cent to 70 per cent, fourteen times the 2010 figure.
- Electric vehicles grew from 0.1 per cent to 12 per cent, a 120-fold increase and the largest multiple in the table.
- Smart home devices rose by 25 percentage points between 2015 and 2020, the largest five-year increase for that technology.
- Wearable technology rose from 1 per cent in 2010 to 48 per cent in 2023, a rise of 47 percentage points.
Useful vocabulary
- adoption rate: The adoption rate of smart TVs rose steadily across the period.
- to be most widely owned: Smart TVs were the most widely owned technology in every year.
- to rise from ... to ...: Smart home devices rose from 2 per cent to 55 per cent.
- to triple: Smart TV ownership tripled between 2010 and 2015.
- to surge: Electric vehicle ownership surged after 2020.
- to remain the lowest: Electric vehicles remained the lowest-adopted technology in every year.
- a fraction of: Electric vehicle ownership was a fraction of smart TV ownership in every year.
- well ahead of: Smart TVs were well ahead of every other technology in 2023.
- a multiple of: Cloud storage reached a multiple of fourteen times its 2010 level.
- percentage points: Wearable technology gained 47 percentage points over the period.
Common mistakes
- Describing the figures as numbers of people, when the table shows percentages of households.
- Calling a rise from 15 to 88 per cent a rise of 73 per cent, rather than 73 percentage points.
- Treating the uneven gaps between years as equal periods, for example comparing the three years to 2023 with the earlier five-year gaps.
- Describing the electric vehicle growth as a steep rise in absolute terms, when the starting base is very small.
- Failing to mention that all five technologies rose in every period shown, which is the key overview point.
Examiner tip: Choose three contrasting technologies, give their start and end figures precisely, and add one multiplier comparison such as the electric vehicle growth, so the summary shows both scale and speed.
Write your answer
Sign in with Google to write online and get 8 free answers marked each month against the IELTS band criteria. No card, no password.
Sign in with Google to writeMore practice questions
Practise all four IELTS skills
Listening, Reading, Writing and Speaking with band 8 samples at ieltsa.org.