Energy Consumption Comparison
The question
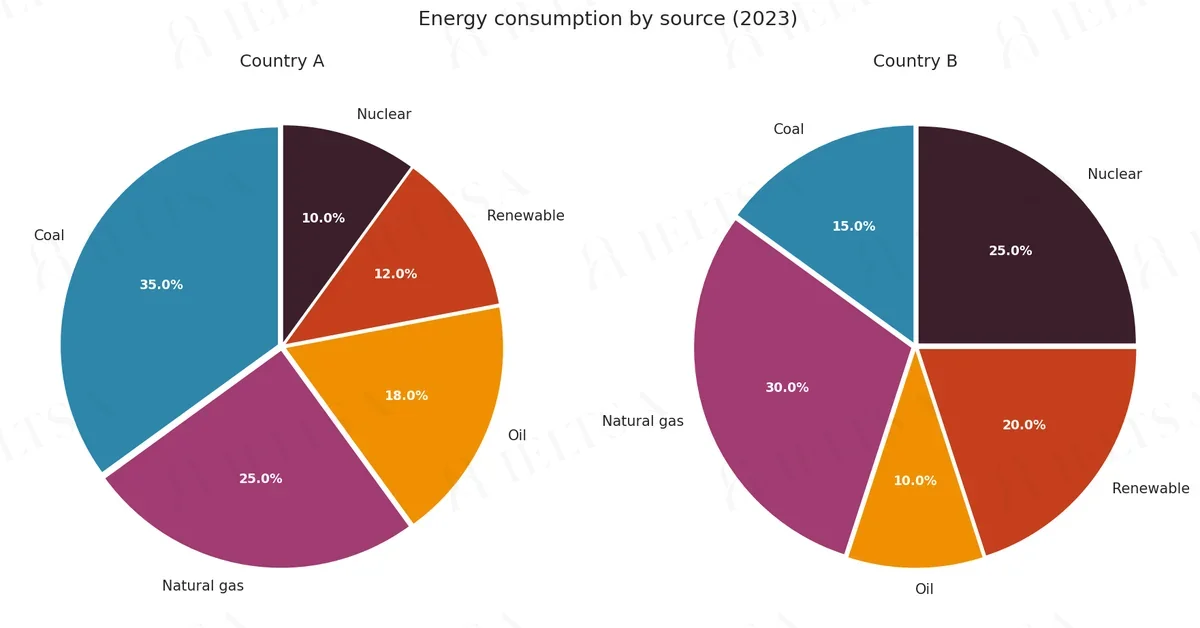
The pie charts below show energy consumption by source in two countries, Country A and Country B, in 2023.
Summarise the information by selecting and reporting the main features, and make comparisons where relevant.
Write at least 150 words.
Instructions
You should spend about 20 minutes on this task.
• Begin with an overview of the main trends or differences
• Compare the two countries source by source
• Use appropriate vocabulary for describing data
• Include figures and units to support your points
How to approach this pie chart question
Pie charts show proportions of a whole. With two pies, the task is to describe how the shares changed or differ.
- Say what the whole is and what the percentages measure.
- Overview: the biggest share and the main shift between charts.
- Compare the largest slices first, then the smallest.
- Use fractions and percentages (just over a third, roughly 20%).
How to plan this answer
Structure
- Introduction: paraphrase that two pie charts show energy consumption by source (coal, natural gas, oil, renewables and nuclear) in Country A and Country B in 2023.
- Overview: Country A relies mainly on fossil fuels, with coal the largest source, while Country B has a more balanced mix in which gas is largest and low-carbon sources are a bigger share.
- Body paragraph 1: Country A source by source, quoting coal 35%, gas 25%, oil 18%, renewables 12% and nuclear 10%.
- Body paragraph 2: Country B source by source, quoting gas 30%, nuclear 25%, renewables 20%, coal 15% and oil 10%, with a direct comparison against Country A for each source.
Key features to spot
- Fossil fuels (coal, gas and oil) make up 78% of Country A's energy (35 + 25 + 18) but 55% of Country B's (15 + 30 + 10).
- Renewables and nuclear together account for 22% in Country A (12 + 10) and 45% in Country B (20 + 25).
- Nuclear is the smallest source in Country A at 10%, but the second-largest low-carbon source in Country B at 25%.
- Coal is the largest source in Country A (35%), yet only 15% in Country B, where it is ahead of oil only by 5 points.
- Gas is the second-largest source in both countries (25% and 30%), a shared feature worth stating in the overview.
- Both pies total 100%, so the percentages can be compared directly even though the countries' total energy use is not given.
Useful vocabulary
- fossil fuels: Fossil fuels account for 78% of energy use in Country A.
- low-carbon sources: Low-carbon sources make up a much larger share in Country B.
- a considerably larger share: Nuclear power has a considerably larger share in Country B than in Country A.
- the largest source: Coal is the largest source in Country A, at 35%.
- by contrast: By contrast, gas is the leading source in Country B, at 30%.
- is roughly double: Renewable energy in Country B is roughly double its share in Country A.
- make up: Coal and gas together make up 60% of Country A's mix.
- the remainder: The remainder of Country B's energy comes from oil, at 10%.
Common mistakes
- Treating the pie charts as total energy amounts rather than shares; the figures are percentages of each country's mix.
- Saying Country B uses no coal or oil; the chart shows 15% coal and 10% oil.
- Swapping nuclear and renewable figures, for example giving Country B renewables as 25% when that is its nuclear share.
- Describing each country's sources in one long list without comparing the same source in both countries.
- Ignoring the overall difference in fossil fuel reliance (78% against 55%), which is the most useful contrast.
Examiner tip: Compare the two pies source by source and keep the same order each time. This makes the contrast easy to follow and shows that you have read both charts accurately.
Model answers by band score
Written for this question to show what changes from one band to the next. Try the task yourself first, then compare.
Band 6 answer
The two pie charts show the energy consumption by source in Country A and Country B in 2023. There are five sources, which are coal, natural gas, oil, renewable and nuclear.
Overall, Country A use more coal and oil than Country B, but Country B use more renewable and nuclear energy.
In Country A, coal is the biggest source with 35%. Natural gas is the second at 25% and oil is 18%. Renewable energy is 12% and nuclear is only 10%, so this country depends on fossil fuels very much.
In Country B, the biggest source is natural gas, which is 30%. Nuclear is 25% and renewable is 20%, which are much more than in Country A. Coal is 15% in Country B and oil is just 10%.
To sum up, Country A rely on coal but Country B has a more balanced mix, with more clean energy sources than Country A.
Why this is band 6
- Covers all five sources for both countries with correct figures (35%, 30%, 25%), so the content is accurate and relevant.
- The overview is present but plain ('use more coal and oil... more renewable and nuclear') and the last paragraph mostly repeats it.
- Language is limited and repetitive ('is... is... is'), with errors such as 'Country A use' and 'Country A rely' that are noticeable but do not block meaning.
- Band 7 would group the sources into fossil fuels versus low-carbon totals, compare directly source by source, and keep subject-verb agreement secure.
Band 7 answer
The pie charts compare the proportions of energy consumed from five sources in Country A and Country B in 2023.
Overall, Country A relied mainly on fossil fuels, whereas Country B drew a much larger share of its energy from nuclear and renewable sources.
Coal was the leading source in Country A, accounting for 35% of consumption, followed by natural gas at 25% and oil at 18%. Together, these three fossil fuels supplied 78% of the total. By contrast, renewable energy and nuclear power contributed only 12% and 10% respectively.
The pattern in Country B was quite different. Natural gas was the largest source at 30%, and nuclear power came next with 25%, which was two and a half times the figure for Country A. Renewable energy provided 20%, compared with 12% in Country A. Coal and oil were much less important in Country B, at 15% and 10% respectively, so fossil fuels made up 55% of the total.
In short, Country A was considerably more dependent on coal, while Country B had a more varied energy mix.
Why this is band 7
- Clear overview that contrasts reliance on fossil fuels with nuclear and renewables, and it is supported by calculated totals (78% and 55%).
- Good range of comparison language ('whereas', 'By contrast', 'compared with') and accurate figures throughout.
- Only a few small slips in precision and the structure is source-by-country rather than fully integrated.
- Band 8 would blend the countries in each paragraph, select detail more sharply and use more flexible phrasing for the comparisons.
Band 8 answer
The pie charts illustrate how the energy consumed in Country A and Country B in 2023 was divided among five sources.
The main difference is that Country A depended heavily on fossil fuels, whereas Country B obtained a far greater share of its energy from nuclear and renewable sources.
Fossil fuels dominated Country A's mix, with coal (35%), natural gas (25%) and oil (18%) together supplying 78% of consumption. In Country B, the equivalent figure was only 55%. Coal showed the sharpest contrast: it was the single largest source in Country A, yet it accounted for just 15% in Country B, less than half the Country A figure. Oil was also less significant in Country B, at 10% against 18%.
Conversely, low-carbon sources were much more prominent in Country B. Nuclear power supplied a quarter of its energy, two and a half times Country A's 10%, while renewables reached 20%, compared with 12% in the other country. Natural gas was the only fossil fuel that was more important in Country B, where it was the leading source at 30%, five percentage points above its share in Country A.
Overall, Country B's energy supply was noticeably more diversified.
Why this is band 8
- Each body paragraph is organised around a comparison (fossil fuels, then low-carbon) rather than a country, which gives natural cohesion.
- Precise, selected detail: 'less than half the Country A figure', 'five percentage points above', and the single exception of natural gas.
- Vocabulary is flexible ('dominated', 'more prominent', 'diversified') and errors are rare.
- Band 9 would be fully seamless, with every comparison quantified economically and an even more natural, varied style.
Band 9 answer
The pie charts compare how energy consumption in Country A and Country B was divided among five sources in 2023.
Broadly speaking, Country A relied overwhelmingly on fossil fuels, whereas Country B drew almost half of its energy from nuclear and renewable sources combined.
Coal, natural gas and oil together supplied 78% of Country A's energy, with coal alone providing 35%, the largest single share on either chart. Country B's dependence on fossil fuels was markedly lower at 55%, chiefly because coal fell to 15% and oil to 10%. Natural gas was the one exception: at 30%, it was the leading source in Country B and exceeded Country A's 25%.
The picture reverses for low-carbon sources. Nuclear power met a quarter of Country B's needs, two and a half times its contribution in Country A (10%), and renewables rose from 12% in Country A to 20% in Country B. Taken together, these two sources accounted for 45% of Country B's consumption but only 22% of Country A's.
In essence, Country A's energy profile was built around coal, while Country B's was far more evenly spread, with no source exceeding 30%.
Why this is band 9
- The overview is exact and quantified ('almost half... combined'), and the later 45% versus 22% totals confirm it.
- Every figure is correct, and calculations (78%, 55%, 45%, 22%) are selected to prove the main contrast.
- Sophisticated, natural phrasing ('The picture reverses', 'chiefly because', 'no source exceeding 30%') with no errors.
- Cohesion is effortless: each paragraph has one clear purpose and the conclusion adds a fresh insight rather than repeating.
Band levels are our estimate against the public IELTS criteria; they are not official scores.
Write your answer
Sign in with Google to write online and get 8 free answers marked each month against the IELTS band criteria. No card, no password.
Sign in with Google to writeMore practice questions
Practise all four IELTS skills
Listening, Reading, Writing and Speaking with band 8 samples at ieltsa.org.