Public Spending by Category, 1980 and 2020
The question
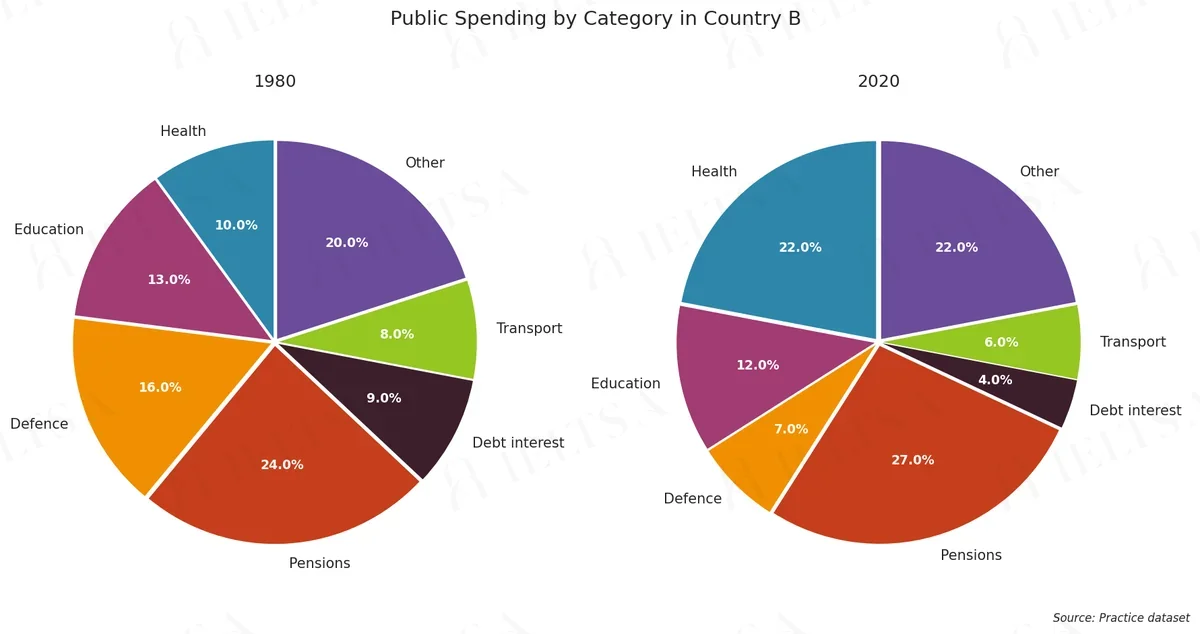
The pie charts below show how public spending was divided between seven categories in Country B in 1980 and in 2020. Summarise the information by selecting and reporting the main features, and make comparisons where relevant.
Write at least 150 words.
Instructions
You should spend about 20 minutes on this task.
• Begin with an overview of the main trends or differences.
• Compare the categories that grew with those that shrank, and note any change in rank.
• Use the percentages shown on the charts where they help, and group the smaller categories sensibly.
• Do not give your own opinions or speculate about causes.
How to approach this pie chart question
Pie charts show proportions of a whole. With two pies, the task is to describe how the shares changed or differ.
- Say what the whole is and what the percentages measure.
- Overview: the biggest share and the main shift between charts.
- Compare the largest slices first, then the smallest.
- Use fractions and percentages (just over a third, roughly 20%).
How to plan this answer
Structure
- Introduction: paraphrase the two pie charts, which show how public spending was divided between seven categories in Country B in 1980 and 2020.
- Overview: Pensions remains the largest category, Health rises sharply, Defence falls the most, and Debt interest and Transport are the smallest.
- Body paragraph 1: the categories that grew, Health (10% to 22%), Pensions (24% to 27%) and Other (20% to 22%).
- Body paragraph 2: the categories that shrank, Defence (16% to 7%), Debt interest (9% to 4%), Education and Transport, and the change in rank of Defence.
Key features to spot
- Health rises by 12 points, from 10% to 22%, the largest increase, moving from fifth place to joint second with Other.
- Defence falls by 9 points, from 16% to 7%, and drops from third place to fifth.
- Debt interest more than halves, from 9% to 4%.
- Pensions are the largest category in both years and grow from 24% to 27%.
- Education is almost unchanged, falling from 13% to 12%, while Transport falls from 8% to 6%.
- The 'Other' category is a large catch-all, rising from 20% to 22%, so mention it once in grouped form.
Useful vocabulary
- accounted for: Pensions accounted for 27% of spending in 2020.
- the largest category: Pensions remained the largest category in both years.
- a sharp rise: Health saw a sharp rise, from 10% to 22%.
- a sharp fall: Defence recorded a sharp fall over the period.
- more than halved: Debt interest more than halved as a share of spending.
- overtook: Health overtook Education and Defence to reach second place.
- a smaller share: Transport took a smaller share of spending in 2020.
- the remaining categories: The remaining categories changed only slightly.
Common mistakes
- Naming Health as the largest category in 2020; Pensions (27%) is larger.
- Describing Education's 1-point fall as a major decline, which overstates a small change.
- Treating the charts as budgets in money terms rather than shares of total spending.
- Listing all seven categories with equal weight instead of focusing on the biggest movers and grouping the rest.
- Saying Health overtook Pensions, which is not what the chart shows.
Examiner tip: Two pies with seven categories will overwhelm a reader. Pick the biggest movers, group the smaller ones, and make sure each sentence compares 1980 with 2020.
Write your answer
Sign in with Google to write online and get 8 free answers marked each month against the IELTS band criteria. No card, no password.
Sign in with Google to writeMore practice questions
Visitor Spending at a Music Festival
Academic · Task 1 · Culture
Energy Consumption Comparison
Academic · Task 1 · Environment
Global Scientific Research Funding Allocation Trends
Academic · Task 1 · Science
IELTS Academic Writing Task 1: Reasons for Volunteering (2005 vs. 2015)
Academic · Task 1 · Society
Practise all four IELTS skills
Listening, Reading, Writing and Speaking with band 8 samples at ieltsa.org.