Global Scientific Research Funding Allocation Trends
The question
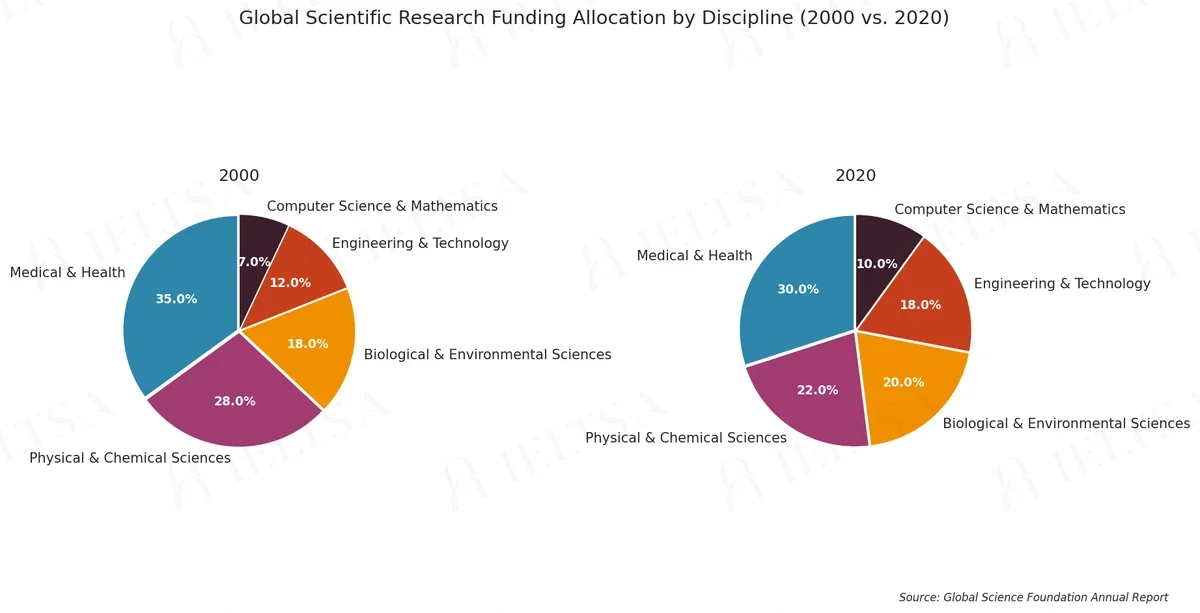
The two pie charts illustrate the distribution of global funding across five scientific disciplines in 2000 and 2020. Summarise the information by selecting and reporting the main features, and make comparisons where relevant. Write at least 150 words.
Instructions
The charts below show the proportion of global funding allocated to different scientific disciplines in the years 2000 and 2020.
How to approach this pie chart question
Pie charts show proportions of a whole. With two pies, the task is to describe how the shares changed or differ.
- Say what the whole is and what the percentages measure.
- Overview: the biggest share and the main shift between charts.
- Compare the largest slices first, then the smallest.
- Use fractions and percentages (just over a third, roughly 20%).
How to plan this answer
Structure
- Overview: one sentence stating that Medical and Health remained the largest share in both years, and that the ranking of the five disciplines did not change.
- Body 1: the 2000 pie, showing that Medical and Health (35 per cent) and Physical and Chemical Sciences (28 per cent) together made up 63 per cent.
- Body 2: the 2020 pie, showing that the top two fields fell to a combined 52 per cent, while Engineering and Technology and Computer Science and Mathematics grew.
- Body 3: the smaller changes, such as Biological and Environmental Sciences rising by two points and Engineering and Technology rising by six points.
Key features to spot
- Medical and Health stayed the largest slice, falling from 35 per cent in 2000 to 30 per cent in 2020, a fall of five percentage points.
- Physical and Chemical Sciences fell from 28 to 22 per cent, a six-point drop, the largest fall of any discipline, though it stayed second.
- Engineering and Technology rose from 12 to 18 per cent, a six-point increase that is a 50 per cent rise in relative terms.
- Computer Science and Mathematics rose from 7 to 10 per cent, a relative increase of more than 40 per cent.
- The combined share of the top two fields fell from 63 per cent to 52 per cent, which shows a shift away from the leading fields.
- The ranking of the five disciplines was the same in 2000 and 2020, although the gaps between them narrowed.
Useful vocabulary
- to account for: Medical and Health accounted for 35 per cent of funding in 2000.
- the combined share of: The combined share of the top two fields fell to 52 per cent.
- to fall by: Physical and Chemical Sciences fell by six percentage points.
- to rise by: Engineering and Technology rose by six percentage points.
- to retain second place: Physical and Chemical Sciences retained second place in both years.
- to make up: Engineering and Computer Science together made up 28 per cent in 2020.
- a minor share: Computer Science and Mathematics held a minor share of 7 per cent in 2000.
- by contrast: By contrast, Biological and Environmental Sciences grew only modestly.
- to widen the gap: The gap between the two leading fields widened slightly.
- the largest category: Medical and Health remained the largest category in both pies.
Common mistakes
- Describing the pie charts as funding amounts in dollars, when the chart shows percentage shares.
- Claiming that Medical and Health funding fell in money terms, when the chart only shows its share.
- Describing every slice in turn rather than grouping the changes into those that fell and those that rose.
- Miscalculating the combined share, such as stating 60 per cent for the top two fields in 2000 instead of 63 per cent.
- Failing to compare both pies, and describing only one year.
Examiner tip: Compare the two pies slice by slice using 'rose by' and 'fell from', and highlight the combined share of the leading fields, since that shows the shift in the overall distribution.
Write your answer
Sign in with Google to write online and get 8 free answers marked each month against the IELTS band criteria. No card, no password.
Sign in with Google to writeMore practice questions
IELTS Academic Writing Task 1: Housing Tenure Pie Charts
Academic · Task 1 · Housing
Visitor Spending at a Music Festival
Academic · Task 1 · Culture
IELTS Academic Writing Task 1: Reasons for Volunteering (2005 vs. 2015)
Academic · Task 1 · Society
Energy Consumption Comparison
Academic · Task 1 · Environment
Practise all four IELTS skills
Listening, Reading, Writing and Speaking with band 8 samples at ieltsa.org.