IELTS Academic Writing Task 1: Housing Tenure Pie Charts
The question
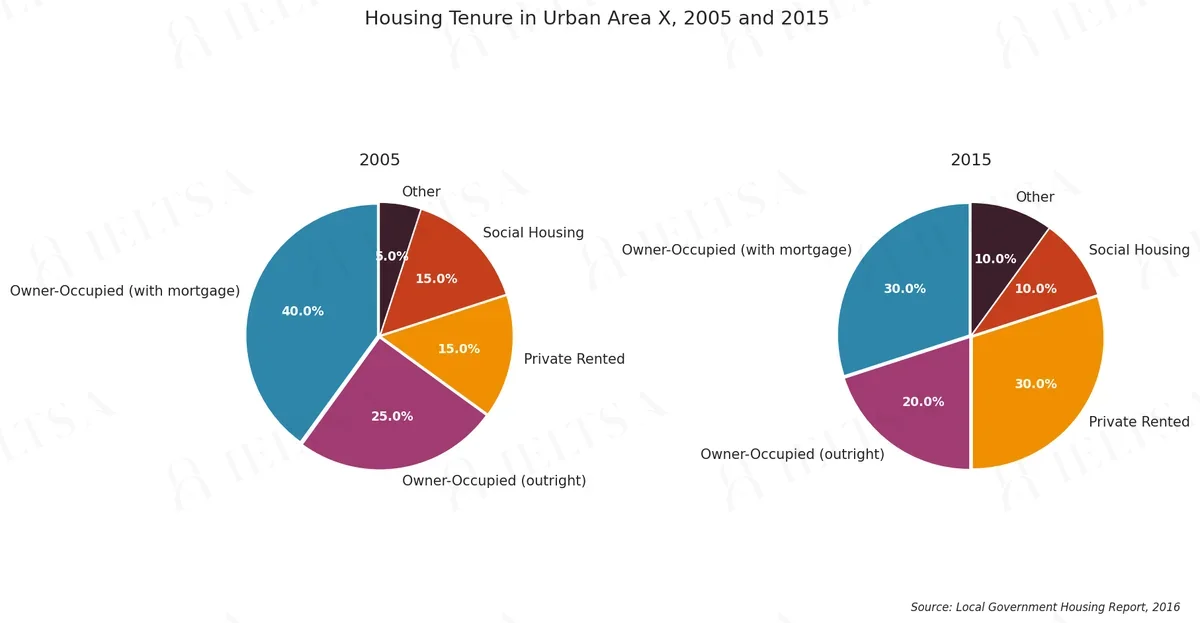
The two pie charts below illustrate the proportion of different housing tenure types in an urban area in 2005 and 2015.
Summarise the information by selecting and reporting the main features, and make comparisons where relevant.
Instructions
You should spend about 20 minutes on this task.
How to approach this pie chart question
Pie charts show proportions of a whole. With two pies, the task is to describe how the shares changed or differ.
- Say what the whole is and what the percentages measure.
- Overview: the biggest share and the main shift between charts.
- Compare the largest slices first, then the smallest.
- Use fractions and percentages (just over a third, roughly 20%).
How to plan this answer
Structure
- Overview: one sentence stating that owner-occupation fell and private renting doubled between 2005 and 2015.
- Body 1: owner-occupied homes, both with a mortgage and outright, which together fell from 65 per cent to 50 per cent.
- Body 2: private renting, which rose from 15 to 30 per cent and drew level with owners with a mortgage in 2015.
- Body 3: social housing and other tenure, which fell and rose respectively, with the 2005 and 2015 figures for each.
Key features to spot
- Owner-occupied with a mortgage fell from 40 per cent in 2005 to 30 per cent in 2015, a drop of ten percentage points.
- Owner-occupied outright fell from 25 to 20 per cent, so combined owner-occupation dropped from 65 to 50 per cent.
- Private rented accommodation rose from 15 to 30 per cent, doubling its share.
- In 2015 private renting drew level with owners with a mortgage, both at 30 per cent, making it joint-largest.
- Social housing fell from 15 to 10 per cent, while the Other category doubled from 5 to 10 per cent.
- In 2005 private rented and social housing were tied at 15 per cent each, so the 2015 change is a clear shift towards renting.
Useful vocabulary
- owner-occupied: The owner-occupied share fell by fifteen points over the decade.
- to double: The private rented share doubled between 2005 and 2015.
- to draw level with: Private renting drew level with mortgage-holders at 30 per cent.
- a decline of: There was a decline of ten percentage points among mortgage-holders.
- a combined share of: Owner-occupiers held a combined share of 65 per cent in 2005.
- to make up: Owner-occupiers outright made up 20 per cent of homes in 2015.
- the largest category: Private renting became joint-largest category by 2015.
- a notable shift: The most notable shift was towards private renting.
- to account for: Social housing accounted for 10 per cent of tenures in 2015.
- to remain unchanged: The share of social housing remained unchanged at 15 per cent in 2005.
Common mistakes
- Describing the pies as numbers of homes, when the chart shows proportions of tenure.
- Merging the two owner-occupied categories without saying so, or leaving one out.
- Saying that private renting became 'the largest' category on its own, when it tied with mortgage-holders.
- Ignoring the Other category altogether, which doubled and should be mentioned briefly.
- Giving reasons for the shift, such as affordability, which the pies do not show.
Examiner tip: Use a combined-share comparison to show the shift from ownership to renting, quoting the figures from both pies and noting the tie in 2015.
Write your answer
Sign in with Google to write online and get 8 free answers marked each month against the IELTS band criteria. No card, no password.
Sign in with Google to writeMore practice questions
Practise all four IELTS skills
Listening, Reading, Writing and Speaking with band 8 samples at ieltsa.org.