Household Spending on Children, 2000 and 2025
The question
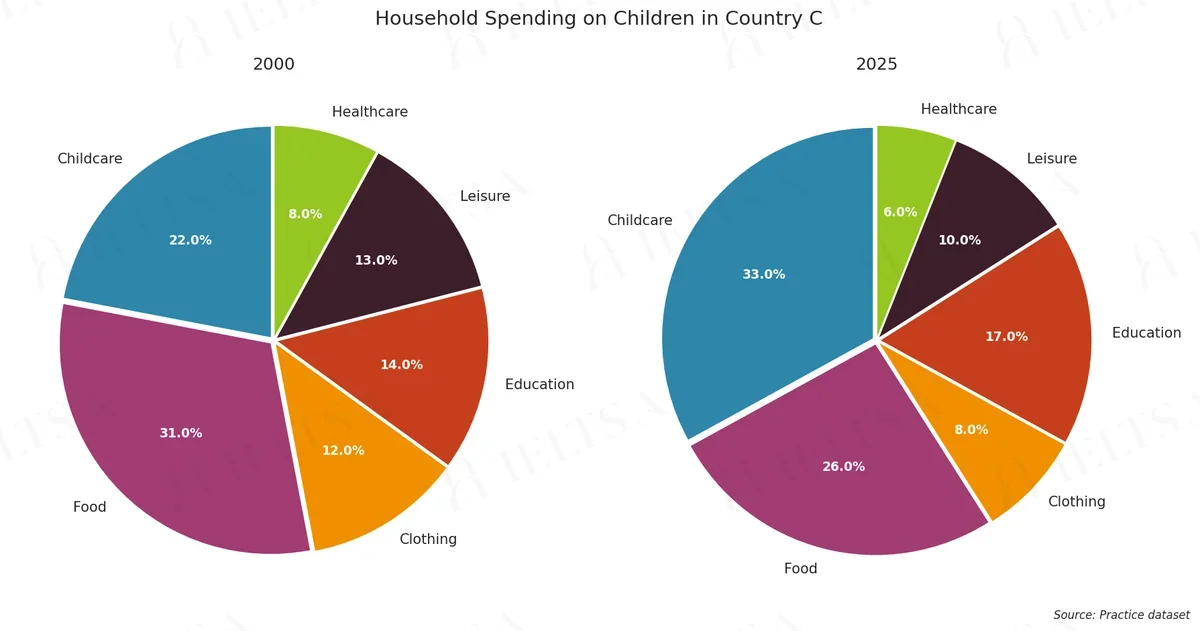
The pie charts below show how households in Country C divided their spending on children in 2000 and in 2025. Summarise the information by selecting and reporting the main features, and make comparisons where relevant.
Write at least 150 words.
Instructions
You should spend about 20 minutes on this task.
• Begin with an overview of the main trends or differences.
• Compare the proportions in each year and identify the categories that grew most and least.
• Use the percentages shown on the charts where they help.
• Do not give your own opinions or speculate about causes.
How to approach this pie chart question
Pie charts show proportions of a whole. With two pies, the task is to describe how the shares changed or differ.
- Say what the whole is and what the percentages measure.
- Overview: the biggest share and the main shift between charts.
- Compare the largest slices first, then the smallest.
- Use fractions and percentages (just over a third, roughly 20%).
How to plan this answer
Structure
- Introduction: paraphrase the two pie charts, which show how households in Country C divided their spending on children in 2000 and 2025.
- Overview: childcare grows the most and becomes the largest category, food falls from the largest to second place, and the smallest categories change little.
- Body paragraph 1: the 2000 distribution, with food (31%), childcare (22%), education (14%), leisure (13%), clothing (12%) and healthcare (8%).
- Body paragraph 2: the 2025 distribution and the changes, with childcare at 33%, food at 26%, and the falls in clothing and leisure.
Key features to spot
- Childcare rises from 22% to 33%, an increase of 11 points, the largest change on either chart.
- Food falls from 31% to 26% and drops from the largest category to the second-largest.
- Education rises from 14% to 17%, the second-largest increase.
- Clothing falls from 12% to 8%, and leisure falls from 13% to 10%.
- Childcare and food together rise from 53% in 2000 to 59% in 2025, so the two largest categories take a bigger share.
Useful vocabulary
- share of spending: Childcare's share of spending rose from 22% to 33%.
- the largest category: Childcare became the largest category by 2025.
- overtook: Childcare overtook food as the biggest category.
- rose by ... percentage points: Childcare rose by 11 percentage points.
- accounted for: Food accounted for 31% of spending in 2000.
- the smallest share: Healthcare had the smallest share in both years.
- dropped from ... to ...: Clothing dropped from 12% to 8%.
- a larger proportion: Childcare takes a larger proportion of spending in 2025.
Common mistakes
- Treating the percentages as money amounts or saying households spent more on children in total.
- Saying food is the largest category in 2025, when childcare (33%) has overtaken it.
- Describing clothing as the smallest category in 2000, when healthcare (8%) is smaller.
- Describing changes as 'per cent' rather than percentage points.
- Speculating about why childcare costs have risen, which the prompt rules out.
Examiner tip: When the same categories appear on two pies, name the category that has moved to the top, quote the change in points, and then cover the smallest categories briefly.
Model answers by band score
Written for this question to show what changes from one band to the next. Try the task yourself first, then compare.
Band 6 answer
The pie charts show how households in Country C spend money on children in 2000 and 2025. There are six categories, childcare, food, clothing, education, leisure and healthcare.
Overall, the spending on childcare increase a lot, and food go down, but it is still a big part of the budget. Most other categories changed only a little, for example clothing and leisure, which both went down a bit.
In 2000, food was the biggest part with 31%. Childcare was 22%, and education was 14%, leisure was 13% and clothing was 12%. Healthcare was the smallest at 8%.
In 2025, childcare was the biggest category with 33%, so it grew by 11%. Food fall to 26%. Education grew to 17%, but leisure went down to 10% and clothing went down to 8%. Healthcare was also the smallest, with only 6%. So we can see that families now spend more on childcare and education, and less on other things.
Why this is band 6
- The overview is present and relevant: it names childcare as the big rise and food as the fall.
- Figures are accurate, but the second paragraph is mostly a list of percentages, with limited comparison between the two years.
- Repetition ('was', 'went down') and errors ('increase', 'food go down', 'fall') show limited range and control, though meaning is clear.
- To reach Band 7, it would group the categories logically (those that grew and those that fell) and control tense and agreement.
Band 7 answer
The pie charts compare the proportion of household spending on children in Country C in 2000 and 2025, divided into six categories.
Overall, childcare showed the biggest increase and became the largest category by 2025, while food, which had been the largest, fell back to second place. Education was the only other category to grow; the rest declined.
In 2000, food accounted for the biggest share at 31%, followed by childcare at 22%. Education, leisure and clothing were similar, at 14%, 13% and 12% respectively, while healthcare was the smallest at 8%.
By 2025, the pattern had changed considerably. Childcare rose by 11 percentage points to 33%, overtaking food, which dropped to 26%. Education also increased, from 14% to 17%. In contrast, spending on leisure fell to 10%, clothing to 8% and healthcare to 6%. Healthcare therefore remained the smallest category, and its fall of 2 points was the smallest change of all.
Why this is band 7
- Clear overview names the largest rise (childcare) and the change at the top, with the rise in education as the only other increase.
- Categories are grouped logically (growth versus decline) and the figures are accurate, e.g. 'rose by 11 percentage points to 33%'.
- Good range and accuracy ('overtaking food', 'respectively') with a few small slips in precision at the end.
- To reach Band 8, it would state the smallest changes precisely (healthcare 2 points, education 3 points) and phrase comparisons more economically.
Band 8 answer
The pie charts illustrate how households in Country C divided their spending on children across six categories in 2000 and 2025.
Overall, the most striking change is the rise of childcare, which replaced food as the largest category. Education was the only other item to take a bigger share, while food, clothing, leisure and healthcare all lost ground.
In 2000, food dominated at 31%, with childcare second on 22%. The remaining categories were fairly close together: education took 14%, leisure 13% and clothing 12%, with healthcare trailing at 8%.
By 2025, childcare had climbed by 11 percentage points to 33%, whereas food had dropped to 26%, a fall of 5 points. Education edged up from 14% to 17%, the smallest rise of the two growing categories. Among the declining items, clothing fell most noticeably, from 12% to 8%, and leisure slipped to 10%. Healthcare, already the smallest share, changed least, shrinking by only 2 points to 6%.
Why this is band 8
- The overview identifies the key shift (childcare replacing food) and the only other growing category, without listing detail.
- Detail is well selected and exact: childcare +11 points, food down 5 points, healthcare down 2 points, education up 3 points.
- Precise and varied vocabulary ('dominated', 'edged up', 'trailing') used accurately, with rare errors.
- To reach Band 9, it would integrate the comparisons more smoothly and avoid some slightly mechanical sequencing of percentages.
Band 9 answer
The pie charts show how households in Country C allocated their spending on children among six categories in 2000 and in 2025.
Overall, childcare underwent by far the largest change, rising from second place to first, while food moved in the opposite direction. Education was the only other category to gain share; clothing, leisure and healthcare all shrank.
In 2000, food took almost a third of the budget (31%), ahead of childcare (22%). Education (14%), leisure (13%) and clothing (12%) were closely bunched, and healthcare, at 8%, was the smallest.
Twenty-five years later, the order at the top had reversed. Childcare had grown by 11 percentage points to 33%, whereas food had fallen by 5 points to 26%. Education also advanced, from 14% to 17%, making it the third-largest item. Clothing declined most among the shrinking categories, losing 4 points to reach 8%, while leisure fell by 3 points to 10%. Healthcare barely moved, easing from 8% to 6%, and remained the smallest share.
Why this is band 9
- The overview is concise and complete: it names the biggest mover, its opposite, and the other changes in a single flow.
- Every figure is exact, and the derived changes are all correct (+11, -5, +3, -4, -3, -2), selected to show proportion.
- Natural, sophisticated phrasing ('closely bunched', 'barely moved') with essentially no errors.
- Cohesion comes from contrast and sequence ('Twenty-five years later', 'whereas'), not mechanical linking.
Band levels are our estimate against the public IELTS criteria; they are not official scores.
Write your answer
Sign in with Google to write online and get 8 free answers marked each month against the IELTS band criteria. No card, no password.
Sign in with Google to writeMore practice questions
Practise all four IELTS skills
Listening, Reading, Writing and Speaking with band 8 samples at ieltsa.org.