Smartphone Usage by Age Group
The question
Instructions
How to approach this bar chart question
A bar chart compares categories or shows change between points in time. Write an overview of the biggest differences, then compare the highest, lowest and any surprise.
- Name the chart, the units and the time or places it covers in one sentence (paraphrase the question).
- Write an overview: the largest and smallest categories, or the main change over time.
- Group the bars into two body paragraphs by similarity, not one by one.
- Quote the key numbers only, with units, and compare them.
How to plan this answer
Structure
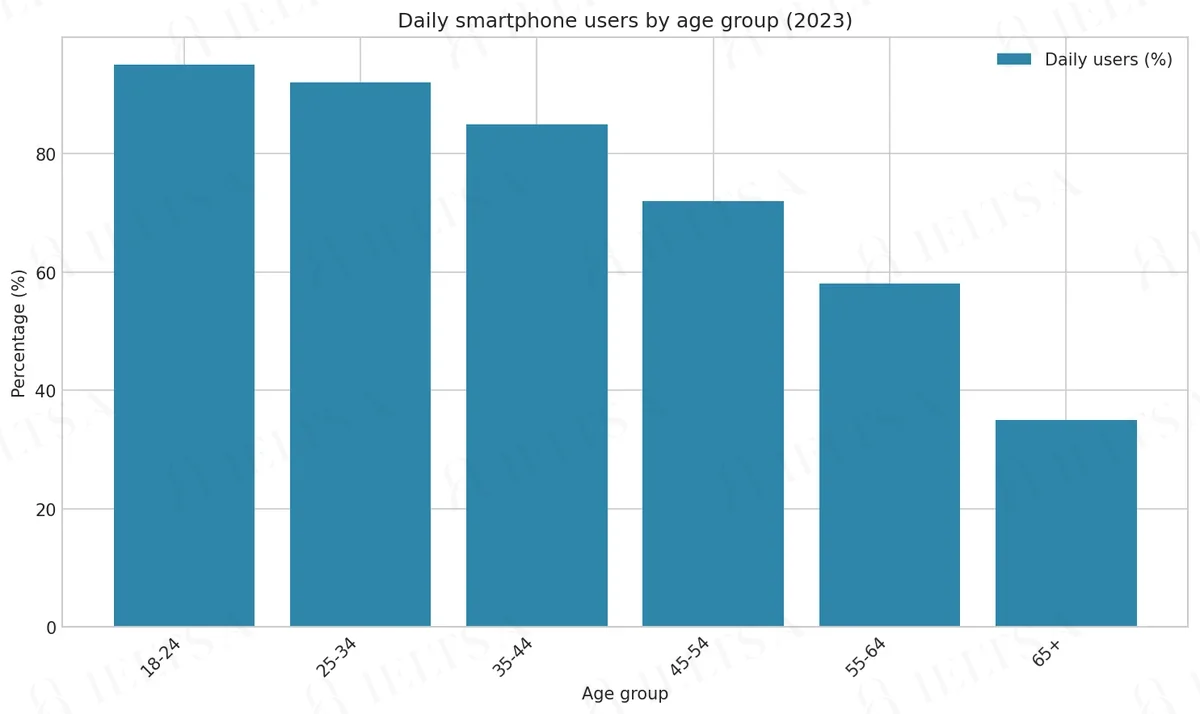
- Introduction: paraphrase the chart. It shows the share of people in six age groups who used a smartphone every day in 2023.
- Overview: daily use falls steadily as age rises. Nearly everyone aged 18-24 uses one daily, while only about a third of people aged 65 and over do.
- Body paragraph 1: the three youngest groups (95%, 92% and 85%), where daily use is near-universal and the drop between them is small.
- Body paragraph 2: the three oldest groups (72%, 58% and 35%), where the decline is steeper, especially between 55-64 and 65+.
Key features to spot
- The 18-24 group is highest at 95%, and the 65+ group is lowest at 35%, a gap of 60 percentage points.
- The sharpest single fall is from 58% (55-64) to 35% (65+), a drop of 23 points.
- The 35-44 group (85%) is the first to fall clearly below 90%, so the decline is gradual rather than sudden.
- The chart is already ordered by age, so the 'highest to lowest' instruction means describing usage as a clear downward slope.
- Figures are for daily use in 2023, so state the year once and keep the figures in percentages.
Useful vocabulary
- daily smartphone users: Daily smartphone users were most common among 18-24 year olds, at 95%.
- a steady decline: Usage shows a steady decline as age increases.
- near-universal: Daily use in the youngest groups is near-universal.
- the sharpest fall: The sharpest fall occurs between the 55-64 and 65+ groups.
- stand at: Usage among people aged 65 and over stands at 35%.
- percentage points: The gap between the two oldest groups is 23 percentage points.
- the figure drops to: Among 55-64 year olds, the figure drops to 58%.
- in contrast: In contrast, fewer than four in ten people aged 65 and over use one daily.
Common mistakes
- Describing the 18-24 and 25-34 groups as using a smartphone 'all the time' or 'always', when the chart shows 95% and 92% daily use.
- Calling the oldest group 'the elderly' or 'pensioners'; the chart label is '65+', so use that wording.
- Listing all six figures in the overview, which leaves no room for a real summary of the trend.
- Quoting the drop between 35-44 and 45-54 as large; it is 13 points, which is smaller than the 23-point drop at the end.
- Forgetting the 2023 date, so the figures read as current or general.
Examiner tip: With an ordered chart, show the slope: name the highest and lowest groups in the overview, then divide the body into the younger and older halves of the scale.
Model answers by band score
Written for this question to show what changes from one band to the next. Try the task yourself first, then compare.
Band 6 answer
Why this is band 6
- Overview is present and relevant (young people use smartphones more than old people), which keeps the answer on task.
- Language is limited and repetitive: 'use a smartphone every day' and 'the ... group' recur, and linking is basic ('After that', 'So').
- Noticeable errors such as 'The bar chart show' and 'The percentage go down' do not block meaning but cap grammar accuracy.
- 'about 60% more' is imprecise (the gap is 60 percentage points). Band 7 would use correct units and a wider range of comparison structures.
Band 7 answer
Why this is band 7
- Clear overview that identifies the trend and the outlier (the oldest group), and the report is well organised from highest to lowest.
- Good range of data language: 'stood at', 'dropped to', 'falling more noticeably', 'Just over half'.
- Figures are accurate and units are given, including the correct '60 percentage points'.
- To reach band 8 it would group the data more selectively and use more flexible phrasing to avoid a figure-by-figure list.
Band 8 answer
Why this is band 8
- Overview is precise and highlights the key pattern: near-universal use among the young and the sharpest fall after 54.
- Selective, well-chosen detail: the contrast between the 60-point gap and the 3-point gap shows analysis rather than listing.
- Natural cohesion ('Beyond that point', 'Put differently') and precise vocabulary ('near-universal', 'fell away rapidly').
- Band 9 would be fully seamless in phrasing, with no slight wordiness, and would integrate the comparisons even more economically.
Band 9 answer
Why this is band 9
- Fully natural, economical overview that captures both the trend and where the decline is steepest.
- Every figure is accurate and the comparisons ('six in ten', 'barely a third', 60 versus 3 points) are interpreted, not just reported.
- Sophisticated yet precise vocabulary ('saturated', 'eased', 'embedded', 'disparity') used without strain.
- Cohesion is seamless and the text is essentially error-free, with every paragraph having a clear, distinct purpose.
Band levels are our estimate against the public IELTS criteria; they are not official scores.
Write your answer
Sign in with Google to write online and get 8 free answers marked each month against the IELTS band criteria. No card, no password.
Sign in with Google to writeMore practice questions
Practise all four IELTS skills
Listening, Reading, Writing and Speaking with band 8 samples at ieltsa.org.